The developer tools built into Chromium-based web browsers are—like the apps they debug—built in plain old HTML, CSS, and Javascript.
If DevTools are essentially just a web app, you should be able to run DevTools on DevTools, right? Indeed, you can! In fact, you don't need to install any special tooling to try it. Everything you need is already in your browser.
How to run DevTools on DevTools
- Open your Chromium-based browser (Edge, Chrome, etc.) and press F12 to open DevTools.
- Pop out the DevTools in their own window by going to the ... menu at the top right and choosing "Undock into separate window," which is the first icon in the Dock side options.

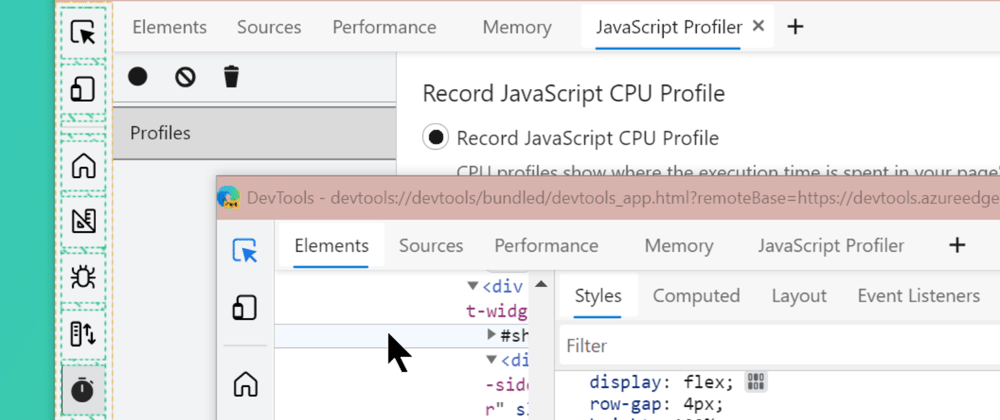
Undocking DevTools - With the DevTools window active, press Ctrl-Shift-I (PC) or Cmd-Shift-I (Mac) to open a second instance of DevTools on DevTools.
Now, you can use the Inspect tool in the newly-opened DevTools instance to hover over elements in the previously-opened DevTools instance. You can tweak div sizes, colors, fonts, and more in the Styles pane, and changes will be reflected right away.
Any changes you make to DevTools won't persist and will reset on reload, so let your imagination run free!

But why?
Aside from having a new party trick to show off, why would you want to run DevTools on DevTools?
One useful scenario is for authoring and debugging DevTools extensions. Developer extensions for React and Vue, for example, are DevTools extensions. If you're authoring your own DevTools extension, you might find DevTools-on-DevTools useful.
Another use case would be for those who want to fix bugs or add new features to the Chromium DevTools codebase. In fact, the folks who build DevTools use DevTools-on-DevTools quite a bit to debug, mock up, and build new features. How do I know? Well, I'm one of those folks! 👋
I have been working with some colleagues on a new interface in Edge DevTools called Focus Mode, which allows you to group different tabs together so your DevTools don't get too cluttered and overwhelming. Running DevTools against DevTools, I was able to use our flexbox debugging features to add outlines to the flex items contained in the new Activity Bar along the left side. I could also play with the size and positioning of icons to make high-fidelity mockups to share with my team.
So, there you have it! Simple instructions for debugging DevTools with DevTools. 🎀


Top comments (11)
Cool. I guess we could just use it to clear the clutter on devtools and maybe make it look nice. I want to see what happens if I write a devtools.css and link it so I get a beautiful devtools
Speaking of custom themes in DevTools, you might also be interested to hear that VS Code theme support is coming to Edge DevTools! See: twitter.com/partytimeHXLNT/status/...
I know EXACTLY what you mean about clutter! In Edge DevTools, we're creating some improvements specifically around this problem.
You can close the tabs you don't need and easily add them back with the + button if you want them back.
The Focus Mode UI I mentioned also helps you group tabs together so you can organize by debugging tasks.
I'm looking at other ways to improve the look and feel of Edge DevTools, so if you have ideas, let me know! :)
Wait, are you working on the devtools? Like working with the company? If yes, then please declutter.
Too bad that this is April Fools joke I was hoping to debug my dev tools extension, but CTRL+SHIFT+I just close the dev tools in Google Chrome.
Really?
It works. Only the arrow which we use to select elements doesn't
Aww, it's no joke, Jakub! Did you remember to first undock DevTools as described in step 2? The Ctrl+Shift+I shortcut will only open DevTools on an undocked instance. Hope that helps! ✨
Aw, that's pretty awesome I didn't read the article carefully. Now I can debug my dev tools extension. Thanks.
TIL - this is very neat! ✨
I am actually looking for an open source project to work on occasionally and stumbled upon devtools.
Definitely will check out what you guys are working on
The correct hotkey on macOS is Cmd-Option-I.
Please update the article.