It shouldn’t come as a surprise that website speed is important to your viewers. It’s the first thing they experience after accessing your website. Your website speed is like an unsung hero that you don’t really notice when it works the way it should, but the second it doesn’t live up to the expectations of your users, they will immediately notice it.
A slow-loading page will frustrate your users to the point where even one extra second will cause them to jump off and look for a solution somewhere else.
You can tell if your website has a decent load time by looking at a few key metrics. If you have a low bounce rate, higher conversion than the average in your space, good SEM results and the Apdex score is high, you are probably the proud owner of a high-performance website. Well done!
If you happen to be on the other side of the spectrum, or perhaps you aren’t exactly sure where you stand, then stick around. I’ll go over how you can run a website speed the right way and tell exactly what to look for to understand what you need to improve.
Looking for a way to speed up your WordPress website specifically? Then check out this short video below for all the tips and tricks:
How to Measure Website Speed
There are many website speed testing tools available out there. From one-trick ponies that can run a simple test and return stats about how fast or slow the site has loaded, to more complex services that take an in-depth look at your website metrics, resources, server information, and even SSL certificate information. Picking the right tool is the first step in a series of important steps that you’ll have to take in order to ensure your website is at peak performance.
In our case, we want a solution that allows us to monitor everything that gets loaded whenever a request is made. You can find a bunch of such solutions in our comparison of the best website speed testing tools. To this end, I’ll use Sematext Synthetics, our synthetic monitoring tool that enables you – among many other cool things – to measure website speed.
We’ll take a look at a well-known web page that can be accessed from every location in the world: apple.com.
Getting started with Synthetics takes only about 2 minutes. Once everything’s set up, you’ll see a dashboard that provides a birds-eye view of all the locations I want to test my site from, the response time, page load time, resource count, and a list of the failed runs.
Now, let’s see what steps you should follow to properly test your website speed:
Test From Multiple Locations
Right off the bat, I can tell there’s a difference in response time while running the test from just two locations. From the US, I get an average of 1.22 seconds response time while Mumbai, India sees 1.82 seconds. That’s a .60 second difference.
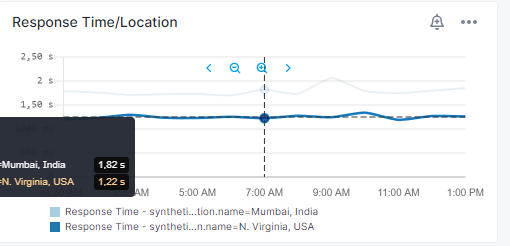
Whenever you have a website that appeals to a worldwide audience, you’ll want to ensure the same efficiency across any location and testing from multiple will help you understand how it performs across all locations.
To mitigate the big difference between locations there are a few options you might explore but probably the easiest one to approach is a CDN which is a geographically distributed network of proxy servers that provide high website availability and performance to your users regardless of where they are in the world.
Remember when I said the one-trick ponies of website testing tools? Those are the ones that don’t offer the test depth you might need when testing a service that caters to a large audience spread across multiple countries. In such cases, you want the option to test from multiple regions, an option that only the more fully developed tools out there will give you.
Run Tests From Different Devices
You’ll also want to test out different devices since not all browsers are created equal and not every connection will run the same. Having the options to create synthetic tests that simulate different devices and connections will give you an idea of how your website might perform under different environments from the ones you are used to.
Measure First Contentful Paint and Largest Contentful Paint
Next up we’ll look at the moment when the browser renders the first bit of content from the DOM. Between the time the user clicks on a link and the FCP happens, the user stays in this uncomfortable limbo where nothing shows up on the webpage. You’ll want to make sure this time of uncertainty is as small as possible.
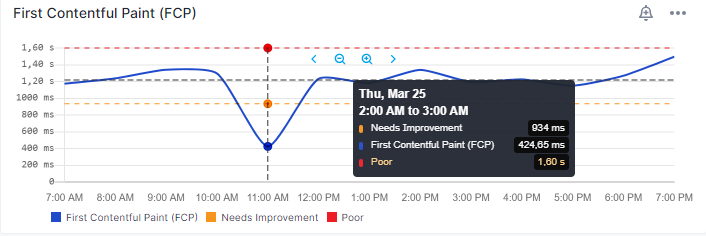
But the FCP doesn’t really give the user too much to work with, as it’s probably only going to show the top part of the logo and perhaps the navigation, not enough for them to actually use the website. This is where the next metric comes into play: the Largest Contentful Paint, or LCP.
More often than not, slow FCP is due to extra unused code that you have to load, large DOM sizes, multiple page redirects, unminified code, and a large server response time (TTFB – look below).
LCP happens when the largest element in the DOM is fully rendered on the screen. This is usually the content that the user is looking for and this is what you want to focus on as much as possible.
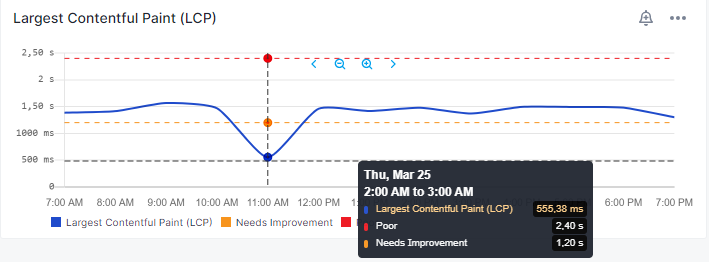
The most common causes of a poor LCP are: slow server response times, render blocking Javascript or CSS code, slow resource load times, and client-side rendering.
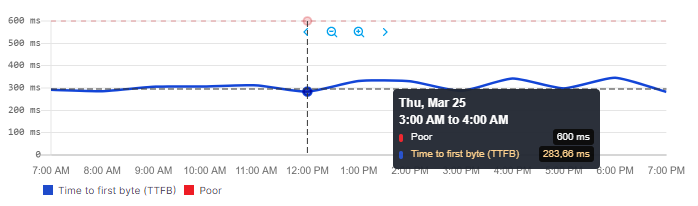
Measure Time to First Byte
Time to First Byte (TTFB) refers to the time it takes for the browser to receive the first byte of data from the server. This is one metric that you won’t want to ignore because a bad TTFB will have a ripple effect over all your other page load times.
TTFB is often caused by the server logic especially when you are using third-party CMS frameworks like Magento, WordPress, or Drupal. Figuring out how each platform works and how you can speed up that TTFP isn’t going to be very easy and does require a little bit of research but things like leveraging Redis for Magento and Litespeed Caching for WordPress in an effort to cache that first response will help tremendously.
Another cause might be the poor performance of the hardware infrastructure that runs your website. In this case, increasing your CPU and RAM might help mitigate the long load time of your TTFB.
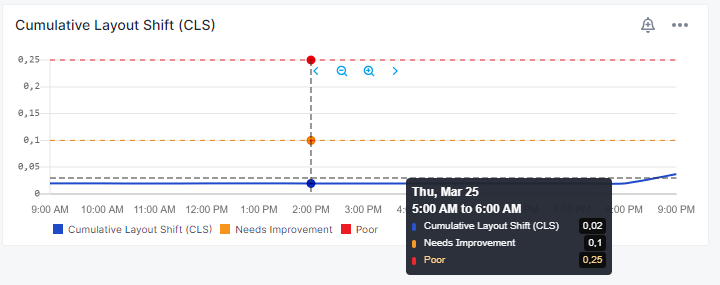
Check Cumulative Layout Shift
Cumulative Layout Shift, or CLS, measures the total individual layout shift scores for every layout shift that occurs during the lifespan of a page. What does this mean? Well, as your content loads, eventually you’ll get to the CSS and JS which will have an impact on your page. Fonts might change size and shape, images might be resized and perhaps moved around which will shift the layout of the entire page.
Imagine a menu with five categories and each one has multiple subcategories. By default, these subcategories are shown but as the CSS and JS files load, they will disappear and hide underneath their parent categories. If you were to click on them at the right moment, instead of clicking on what you intended, you would click on something totally different.
Check the Number of Requests
The next thing you’ll want to look at is the number of requests. As you can imagine, every request you make will add more time to the page load time. You’ll want to make sure you limit the number of requests you make to a minimum and carefully watch the time it takes for each one to load.
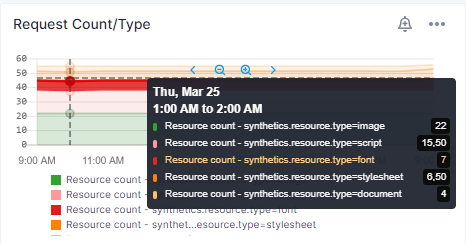
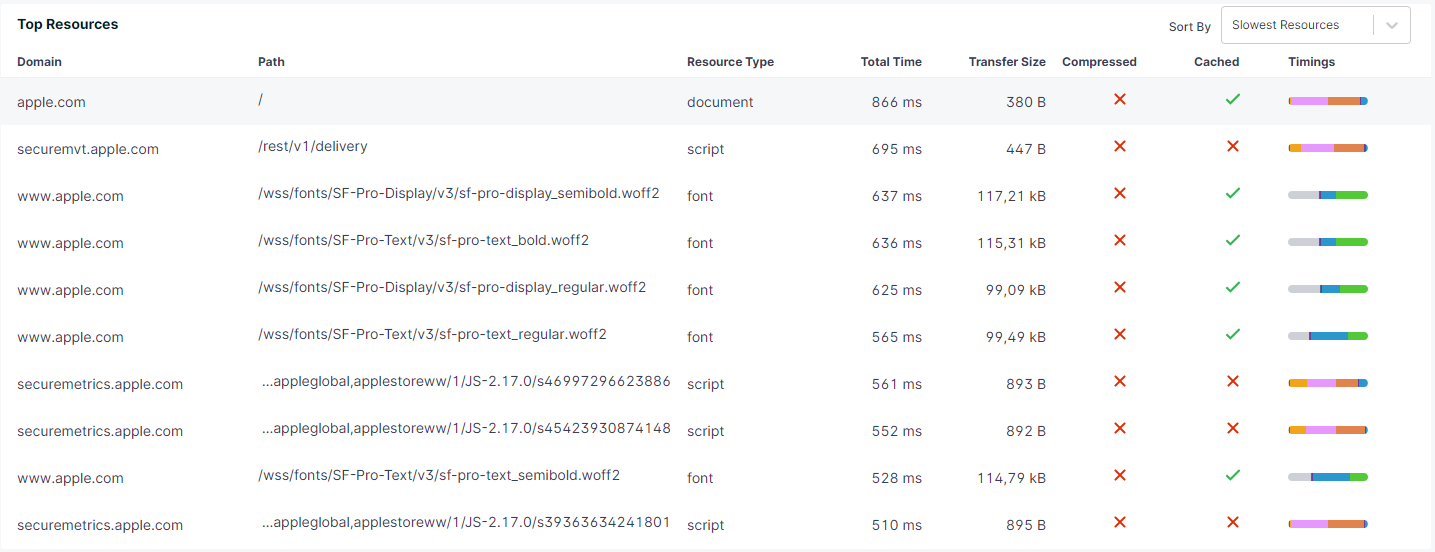
While we are talking about requests, I should point out that not all requests are created equal. While a simple JavaScript might take a few milliseconds to load, an image might take significantly longer. With Sematext Synthetics you can see a breakdown of every single resource that you load, details on chasing or compression, their size, and how long it took to transfer.
This way, you can take the necessary steps to reduce the load time by either loading resources from a CDN, minimizing the code, or caching specific sections.
Last but not least, we should be looking at individual runs from specific locations. This allows us to see details on how the website was performing at any given point. Sematext Synthetics will show you both passed and failed runs so you can understand exactly what needs to be improved to get rid of certain bottlenecks.
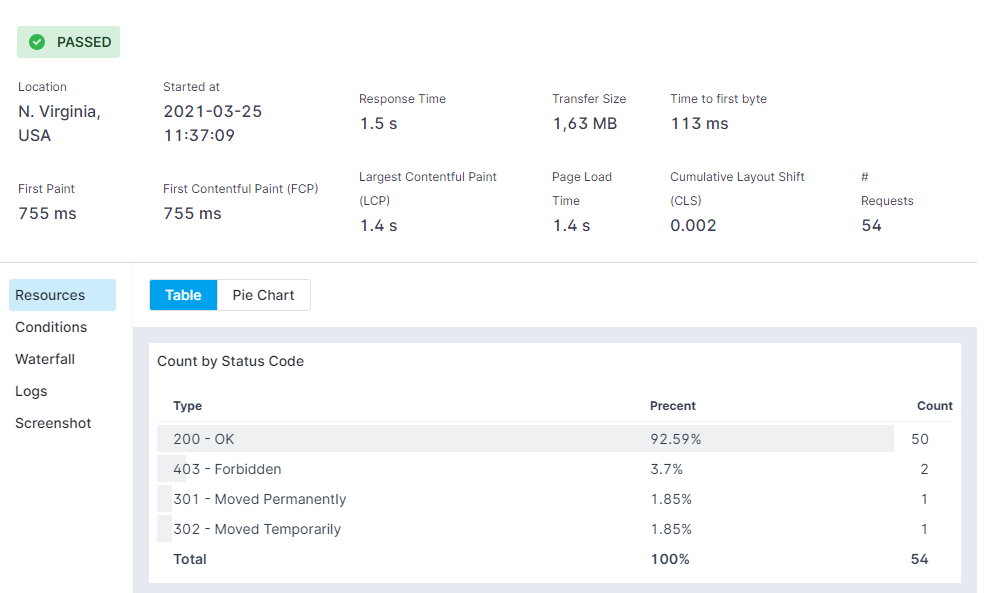
You can set different conditions for your tests and have Sematext send you an alert via Email or Slack (or any of the many other integrations available) whenever something goes sideways.
Sematext displays waterfall charts with all your resources and their load times, a screenshot view with a snapshot of the page, and a logs section where you can see all the recorded logs for that particular test. This is especially useful when trying to debug issues that aren’t as cut and dry to begin with. Together with Sematext Logs, this provides a 360 view of your website and the infrastructure underneath.
If you want to learn how to optimize your website’s speed, read our article with tips on how to improve website performance.
Conclusion
I feel that at this point, you’ll definitely understand, beyond a doubt how crucial your page speed is. But I can’t stress this enough – you need to look at the right metrics to get a proper understanding of what’s going on and how your site speed affects your user experience.
With tools like Sematext Synthetics, I’d take the time to benchmark my website against competitors as it will give me an idea as to why they are faster (or slower) than me, what are the areas I need to improve, and a get better understanding of where the industry is at any given time. Check out the video below to learn more about how Sematext Synthetics can help:
Since you get a 14-day free trial of Sematext and with plans starting at only $2/monitor, there’s really nothing stopping you from giving your website the attention it deserves. Try it and see how easy it is to ensure optimum website speed test and keep your users happy!