Dr. James Trauer is an Associate Professor and Head of Monash University’s Epidemiological Modelling Unit. Recently I sat down with James and his team’s software engineer David Shipman to learn about how they’re informing COVID-19 government policy decisions using Buildkite, EC2, and S3.
Transforming thousands of inputs
The COVID-19 pandemic has been an unprecedented threat to human health. Dr. Traurer’s team builds digital infrastructure for cutting-edge modelling techniques, helping government policy makers across Australia, Malaysia, Philippines, Nepal, and Sri Lanka respond to the ever-changing pandemic.
“We meet with policy makers once a week, and present any updated modelling results that we have. They'll ask us questions and we'll try to provide them with some sort of insight into what we think might happen with a particular policy change based on results,” Trauer said.
Turning thousands of inputs into a digestible form for the policy makers is not a task unique to the Monash team, but their approach is somewhat different from those of other academic institutions.
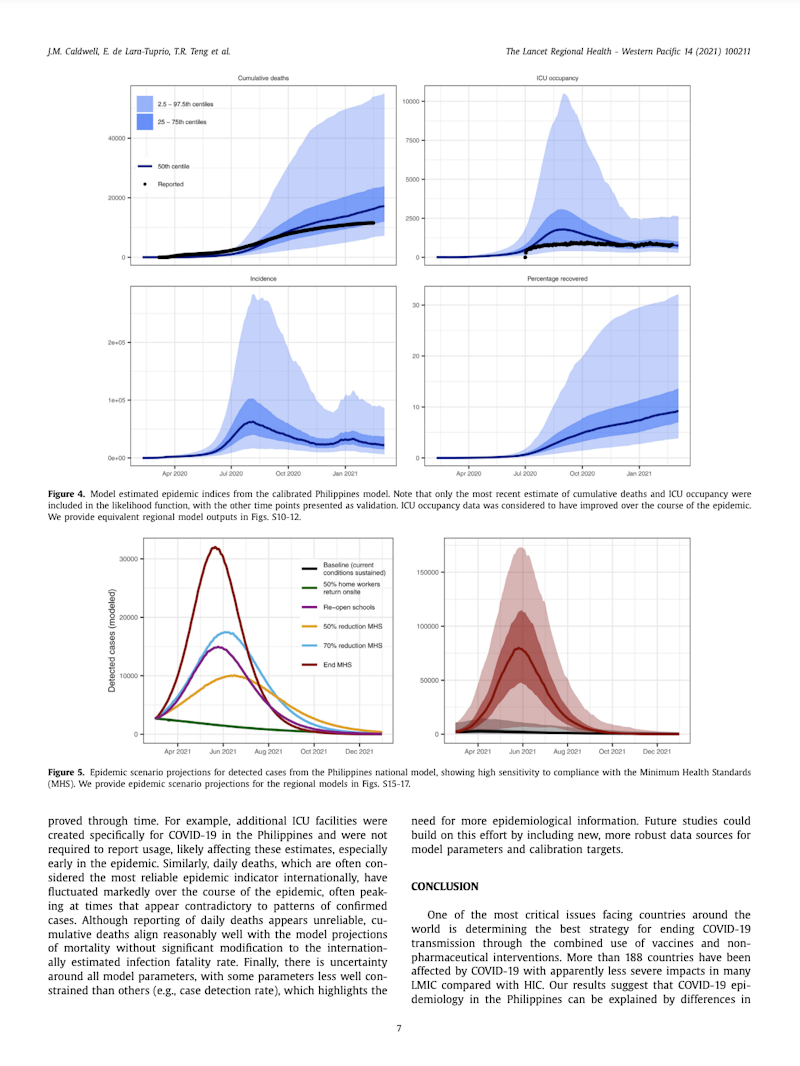
Excerpt from "Understanding COVID-19 dynamics and the effects of interventions in the Philippines: A mathematical modelling study" (source)
Open source tools and Buildkite pipelines
Monash's team have two open source projects that help power their modelling: Summer is their Python-based framework for disease modelling, and AuTuMN is the software model that helps generate the COVID-19 modelling results and is built using the Summer framework.
The AuTuMN project is responsible for producing the results using hundreds of parameters and static inputs from mostly publicly-available data. This includes information like case numbers, population density, hospitalizations, ICU admissions, and vaccination rates.
Upon receiving updates to numbers, the team puts the updated data into the repository in encrypted form.
“And then we'll push the encrypted data out, pull that down, decrypt it, including on Buildkite,” said Trauer.
Next, they calibrate.
“We might run a one-minute calibration that will achieve nothing at all, other than just checking that it doesn't explode,” Trauer said. “Then we'll push up what we want to do with the calibration to GitHub and then get Buildkite to run the calibration, which is just running the model again and again and again, with different parameter sets to work out, finding which combinations of parameters fit well. That gives us a spread of results.”
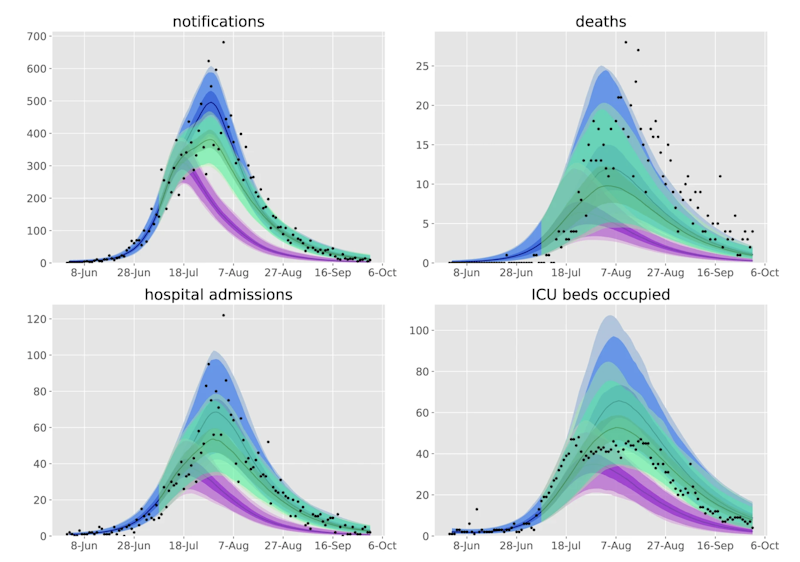
Counterfactual scenarios compared against baseline calibration and data (source)
Scientific modelling on a modern tech stack
Dr. Trauer leads a team of six who come from a range of backgrounds including mathematics and physics. David Shipman, the team’s lone software engineer, notes that the Monash Epidemiological Modelling Group differs from other academic institutions in their overall comfort in working with code and traditional software engineering practices.
“We are pretty unusual in terms of what we're doing in our tech stack for scientific modelling,” Shipman said.
“We have a basic end-to-end pipeline for our workflow where our developers or our modellers work locally on their Windows machines, tweaking models and testing ideas. When they want to do some kind of real work and run it, we've got Amazon EC2 instances and an S3 bucket with all the data and that's where everything goes and actually runs.”
Shipman also noted that the team uses git and GitHub very actively for deployments, configuration, and job identifiers. Again, differentiating the Monash group from traditional modelling.
An example model from the Summer docs
import numpy as np
import matplotlib.pyplot as plt

from summer import CompartmentalModel

# Define the model
model = CompartmentalModel(
    times=[0, 20],
    compartments=["S", "I", "R"],
    infectious_compartments=["I"],
    timestep=0.1,
)
model.set_initial_population(distribution={"S": 990, "I": 10})
model.add_infection_frequency_flow(name="infection", contact_rate=1, source="S", dest="I")
model.add_transition_flow(name="recovery", fractional_rate=1/3, source="I", dest="R")
model.add_death_flow(name="infection_death", death_rate=0.05, source="I")

# Run the model
model.run()

# Visualize the results.
subplot = {"title": "SIR Model Outputs", "xlabel": "Days", "ylabel": "Compartment size"}
fig, ax = plt.subplots(1, 1, figsize=(12, 6), dpi=120, subplot_kw=subplot)
ax.legend(["S", "I", "R"])
for compartment_idx in range(model.outputs.shape[1]):
    ax.plot(model.times, model.outputs.T[compartment_idx])

start, end = ax.get_xlim()
ax.xaxis.set_ticks(np.arange(start + 1, end, 5))
plt.show()
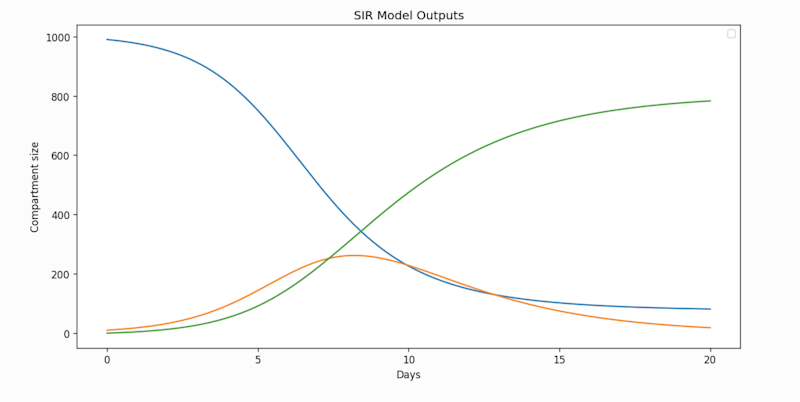
Output from the example model
Embracing modularity and automated testing
The Epidemiological Modelling Group began developing their platform for infectious diseases modelling prior to the COVID-19 pandemic. Although its initial purpose was for tuberculosis modelling, the platform has been generalized in such a way that it can be applied to different diseases in the future.
The reusability of the model fits in neatly with Monash’s ability to incorporate software engineering practices.
“I think it's important to have a really modular code base,” Trauer said. “And then we trust their internals and have tests all around them.”
He noted that while it's impossible to say something is so well tested that it can't possibly give you incorrect results, they are necessary for models that are being used by different people in different ways.
Before we ended our interview, I asked Dr. Trauer if he thought a broader convergence of scientific modelling and software engineering was on the horizon.
“Yes,” Trauer said. “I guess that’s what we’re trying to do. Two years ago, we had no tests in our code base. And I think probably most modelling groups around the world have no tests. They don't understand the concept of tests. Now we have about 700 tests on that code base. I just feel much more confident.”
Thank you to Dr. Trauer for taking the time to share how his team is using Buildkite. If you’d like to know more about his team and their software, see the Epidemiological Modelling Unit’s website and their open source projects on GitHub.