
We started collecting Real User Monitoring (RUM) data from GOV.UK users on 16 June 2021 to allow us to capture a more complete picture of how our users experience the performance of GOV.UK. We now want to give an update on what we have learned and how it is helpful in planning improvements in the future.
What have we learned?
One of the most important things we’ve learned is that GOV.UK is already a really quick website. It’s important to measure and know this, as this gives us a baseline to work from.
We know this by comparing our RUM data to global RUM data that is available from the Chrome User Experience Report (CrUX). The global data states that a good page load time experience is when a page loads in up to 1 second. For the top 1,000,000 websites on the web:
- 35.2% of sites had a good page load score on desktop
- 20.9% of sites had a good page load score on mobile
Now, considering our median page load time for the month of April to May 2022 was 0.455 seconds for all pages and devices visiting GOV.UK, this gives you an idea of how well GOV.UK is doing in terms of real world web performance.
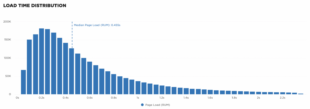
Looking at the page load distribution data graph, above, for the month, we can see that 83% of our visitors have a page load time that is classed as “good” according to CrUX’s definition of a good experience (1 second).
The most important aspect of this 83% statistic is the remaining 17% of GOV.UK users who receive a "bad experience". When you are receiving millions of visits per month, that 17% will account for a lot of users! At the extreme end, we see some of these users have to wait up to 2.35 seconds for a page to load. This is 135% slower than what is considered “good” and 417% slower than the overall median.
Why this is important
This is important because we've recognised a cohort of users that we simply didn’t know existed before we started collecting RUM data. As these users were already struggling with page performance, they’d be less likely to report these problems to us through any standard feedback routes, so they would effectively be suffering in silence.
Now that we have recognised this cohort, we are able to investigate further why the site is so slow for them and focus on improving their performance. This will improve the performance for everyone. As the saying goes: “A rising tide lifts all boats”.
What do we know about these users?
It’s worth reiterating at this point that the anonymous performance data gives us insights into a user's experience when they visit GOV.UK. We do not capture personal data in this process, and the data is only collected if a user opts in via cookies on GOV.UK.
If we delve into the data of the 17% of users a little further, we can start to look for information as to why these users' page load is taking from 2.3 to 2.4 seconds. The vast majority (75%) of users are located in the United Kingdom. The other 25% are located as far away as India, Australia and New Zealand.
If we look at the user sessions and their location within the UK, there isn’t really a particular pattern to be seen as slow experiences occur all over the country. But what is surprising is that there are certain regions of the UK that you’d expect to have excellent connectivity and therefore download speed wouldn’t be an issue. This is especially true for London, a city with global connections and infrastructure. But from the data we can see users from City Of Westminster, Southwark, and Tower Hamlets.
So maybe it isn’t a connectivity issue. What about a user's device or browser? The most popular type of device is an Android mobile phone, accounting for 36% of all slow visits. These devices tend to have a relatively low amount of memory of 4GB (33% of devices).
The viewport size of the devices tends to be smaller than most top of the range devices, with screens as small as 360 by 560 pixels.
All this data suggests that GOV.UK has a demographic of users that are on low-specification, relatively inexpensive mobile devices.
Looking at the pages these users are trying to visit gives some insight into their needs and why they are visiting GOV.UK. The top 4 pages visited are:
- Sign in to your Universal Credit account
- Report a COVID-19 rapid lateral flow test result
- Welcome to GOV.UK (homepage)
- Using the NHS COVID Pass to demonstrate COVID-19 status
As you can see from the pages, these users are trying to access either their Universal Credit account or important pages related to coronavirus (COVID-19). We would also assume they are visiting the homepage to begin their search for a particular government service.
What is clear to see from this data is that there are users who are struggling to get to very important pages and services on GOV.UK. Thankfully, the use of RUM data has shown that these users exist, so we can start making changes to GOV.UK to help these users achieve a better experience and make sure they get from A to B quicker, so they can move on with their life with as little hassle as possible.
What’s next for the performance of GOV.UK
In the future, we have plans that should directly improve the experience of the users we’ve identified above. This involves both the reduction of assets sizes (mainly JavaScript) which can really slow down pages on low-specification devices. All the way to more fundamental network architecture changes like enabling HTTP/3 + QUIC, which should improve performance for users on slower, less-reliable connections across the country (for example, rural areas).
What’s next for RUM on GOV.UK
This is just a single important example of what we have learned from the collection of RUM data over the past year. There’s simply too much data collected to go into all the learnings we have made over the past year! But it’s important to realise that as we continue to use and collect this RUM data, we are able to compare periods of time and make sure we are improving performance for all our users and not making it worse. This is especially important for users with limited access to modern technology, that we have identified above.
Subscribe to Inside GOV.UK to keep up to date with our work

2 comments
Comment by Manu posted on
As always, I appreciate your transparent manner of giving insights! Thank you and keep going - you're doing a great job!
Comment by Laura Stevens - Inside GOV.UK Editor posted on
Thank you! All the best, Laura