A Complete Guide to Web Performance Budgets

It's easier to make a fast website than it is to keep a website fast. If you've invested countless hours in speeding up your site, but you're not using performance budgets to prevent regressions, you could be at risk of wasting all your efforts.
In this post we'll cover how to:
- Use performance budgets to fight regressions
- Understand the difference between performance budgets and performance goals
- Identify which metrics to track
- Validate your metrics to make sure they're measuring what you think they are – and to see how they correlate with your user experience and business metrics
- Determine what your budget thresholds should be
- Focus on the pages that matter most
- Get buy-in from different stakeholders in your organization
- Integrate with your CI/CD process
- Synthesize your synthetic and real user monitoring data
- Maintain your budgets
This bottom of this post also contains a collection of case studies from companies that are using performance budgets to stay fast.
Let's get started!
Why prioritize fighting regressions?
There's a great quote from Michelle Vu (an engineering lead at Pinterest) from her talk at PerfNow a few years ago:
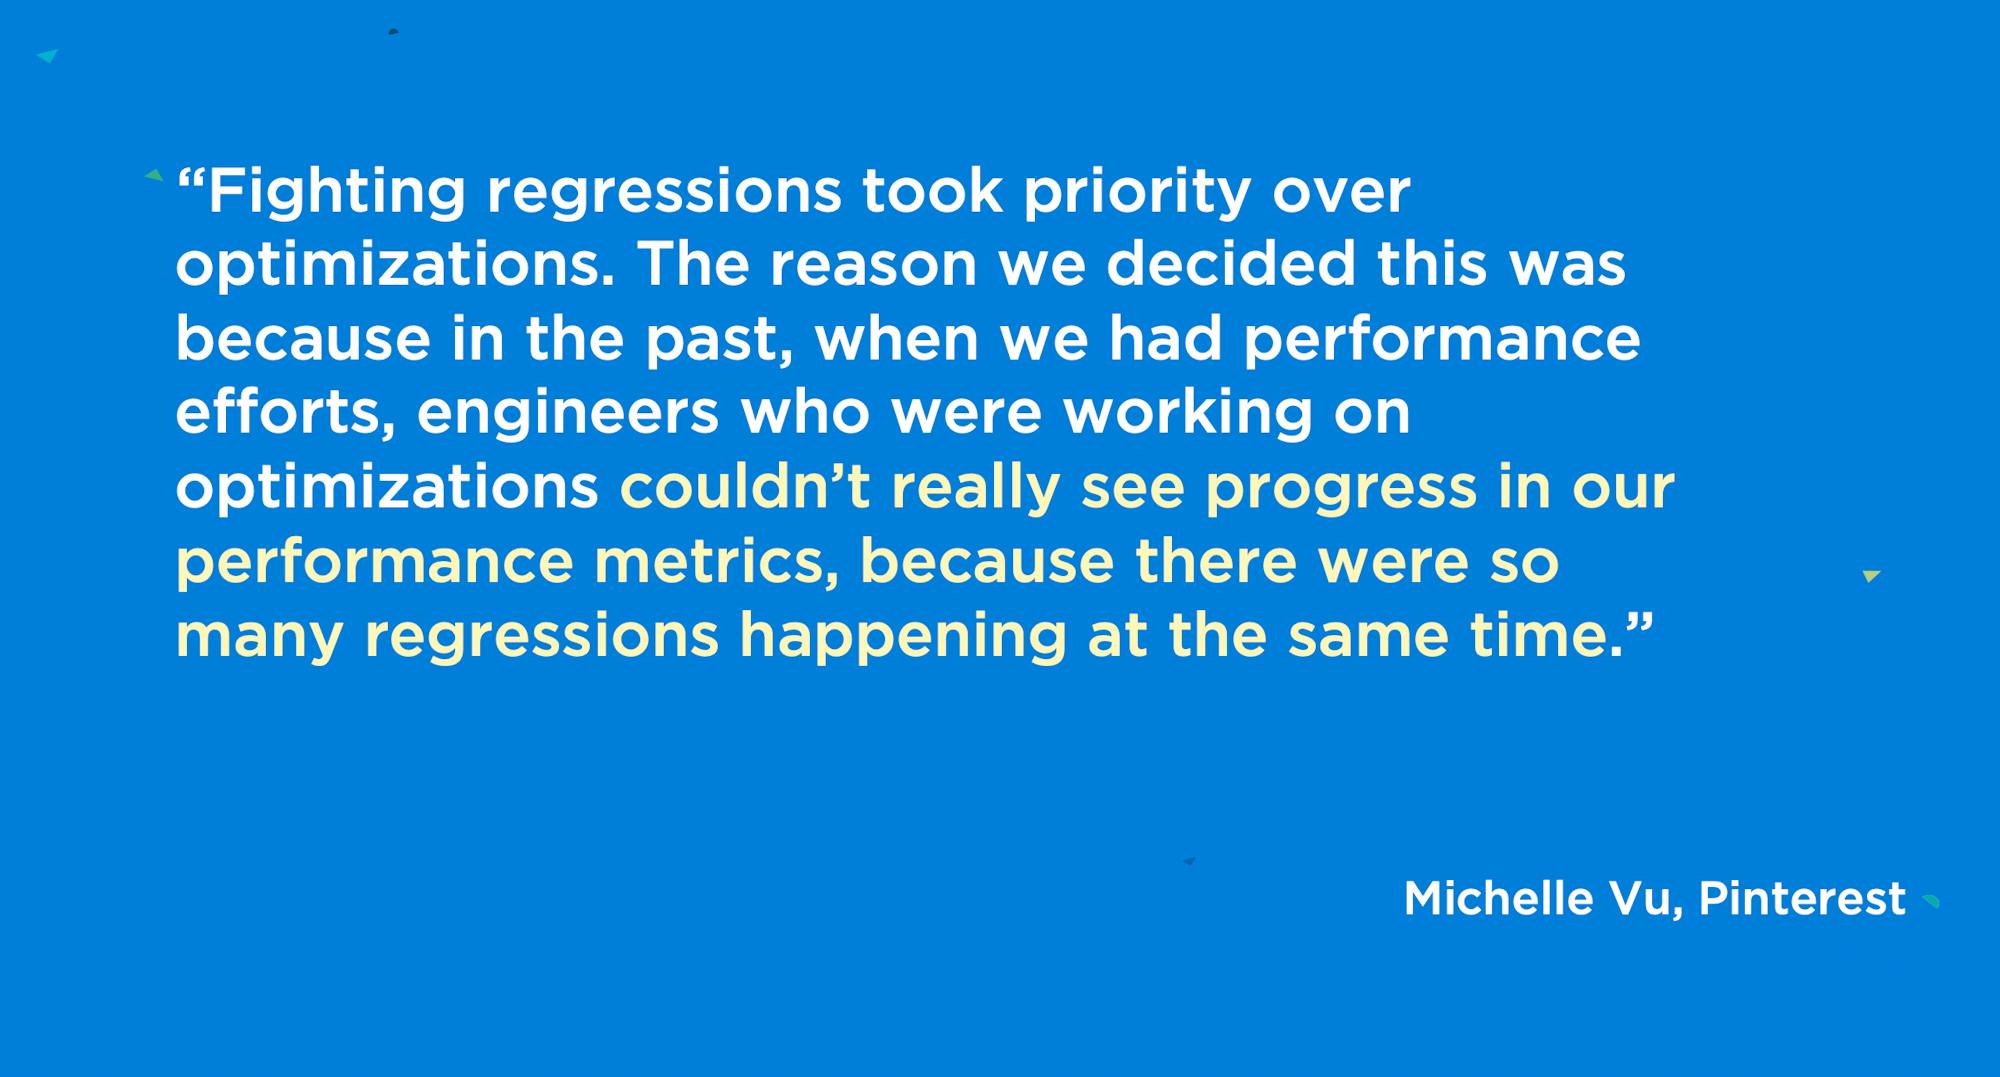
In other words, why work on continuously filling the bathtub if you're not going to plug the drain?
Background: How performance budgets work
1. What is a performance budget?
A performance budget is a threshold that you apply to the metrics you care about the most. You can then configure your monitoring tools to send you alerts – or even break the build, if you're testing in your staging environment – when your budgets are violated.
2. What should a performance budget look like?
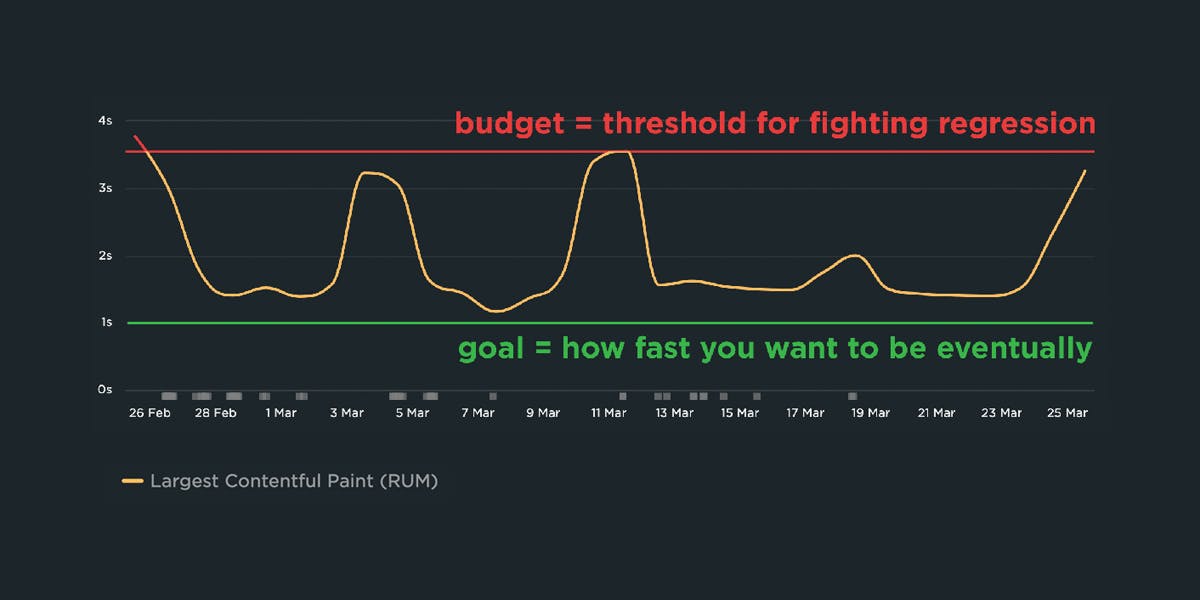
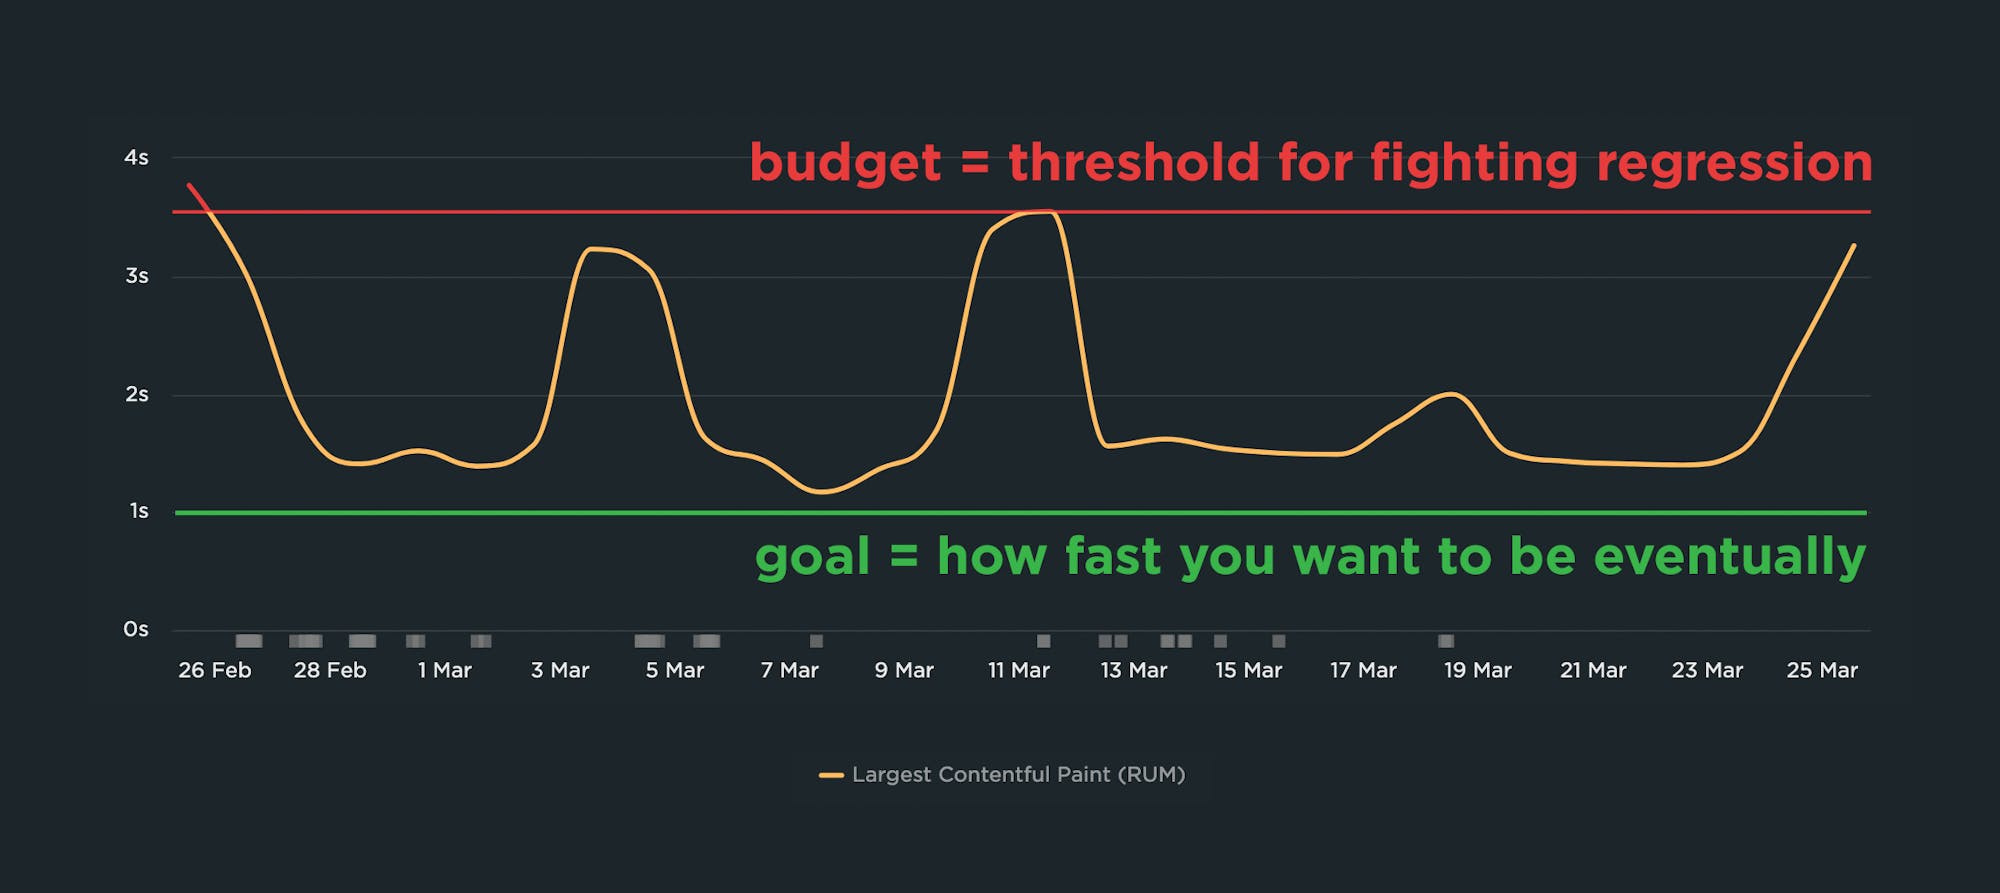
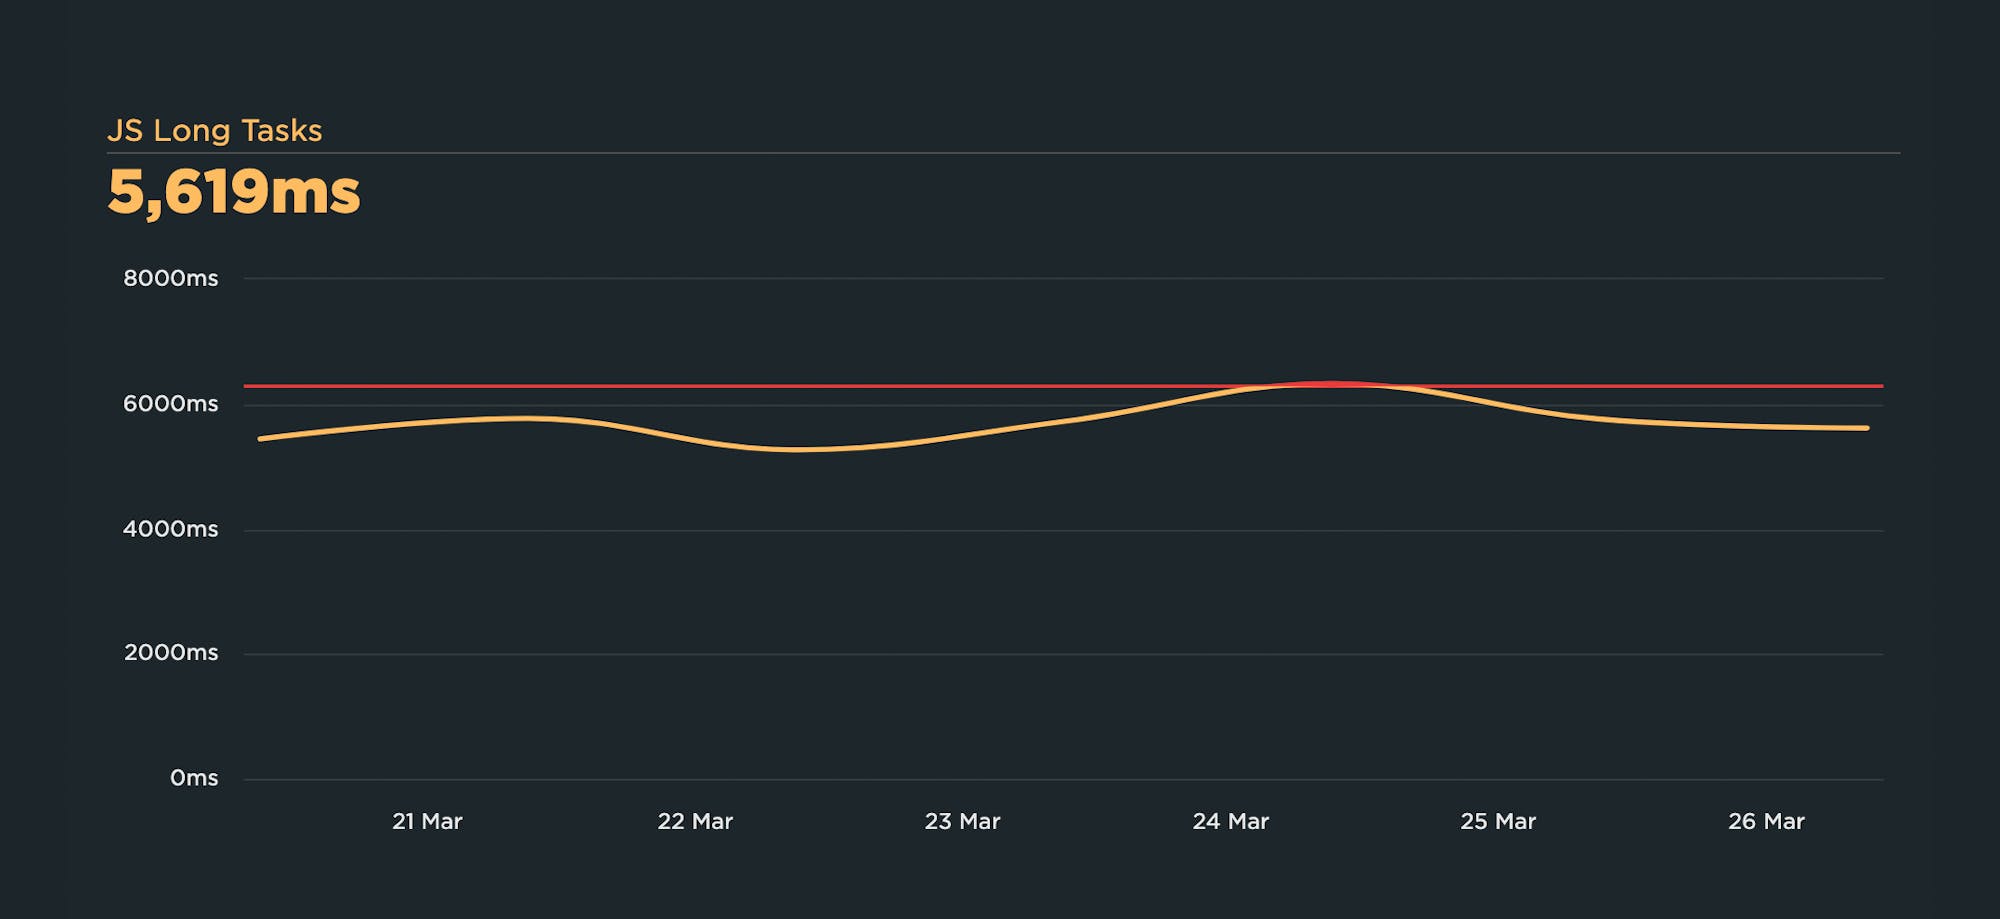
A good performance budget chart, such as the one above, should show you:
- The metric you're tracking
- The threshold you've created for that metric
- When you exceed that threshold
- How long you stayed out of bounds
- When you returned to below the threshold
3. How do you determine budget thresholds?
A good practice is to:
- Look at your last 2-4 weeks of data for a given metric
- Identify the worst number
- Set your performance budget for that number

In the example above, you can see a time series chart that shows Largest Contentful Paint times over a one-month period. The slowest LCP time is 3.55 seconds, therefore the performance budget – represented by the red line – is set for 3.55 seconds. As the person responsible for the performance of this page, you don't want to see it get worse than this while you work to make things faster.
4. Performance budgets vs. performance goals
Your performance budgets are NOT the same as your performance goals.
Performance goals are aspirational. They answer the question "How fast do I want to be eventually?"
Performance budgets are practical. They answer the question "How can I keep my site from getting slower while I work toward my performance goals?"
Let's continue with the example above, where the worst LCP time was 3.55 seconds, making that the most pragmatic performance budget. At the same time, the person responsible for this page might know that they would like the LCP time to be blazing fast at just 1 second or less. That's the goal, but it's not the budget.
It's important to have your 1-second performance goal in mind, but it's not helpful to make that number your performance budget. If you do, you'll end up with a chart that looks like this:
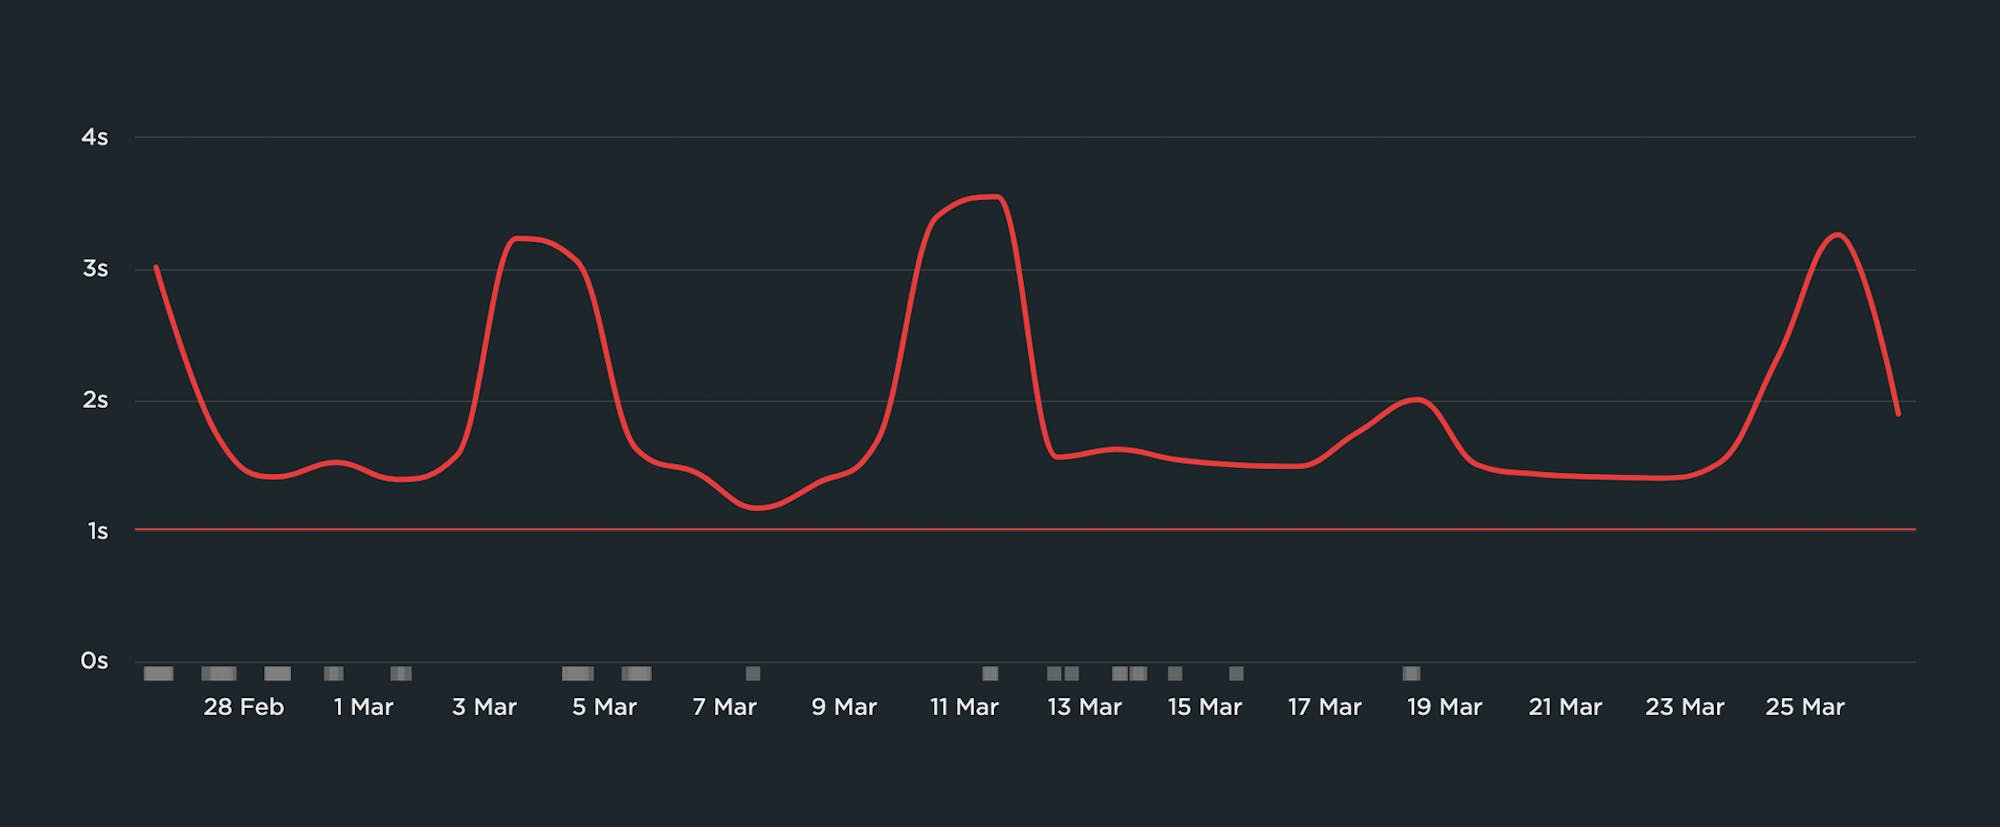
There are a few reasons why this chart isn't helpful:
- It's demoralizing. It looks like a history of failure that's intended to shame you, not help you.
- It's not actionable. Because you've already violated your budget, you won't get alerts if performance degrades even further.
- It's ignorable. Because it's demoralizing and not actionable, you'll quickly learn to ignore it or rationalize it away.
5. Why do you need performance budgets?
Performance budgets mitigate two of the biggest challenges you probably face in your daily life: not enough time, plus too many people touching the site.
You're busy. You don't have time to check your charts daily to make sure your latest deploy hasn't introduced any regressions. After you've set up performance budgets, you can relax knowing that everything is fine until you get an alert in your inbox or Slack channel.
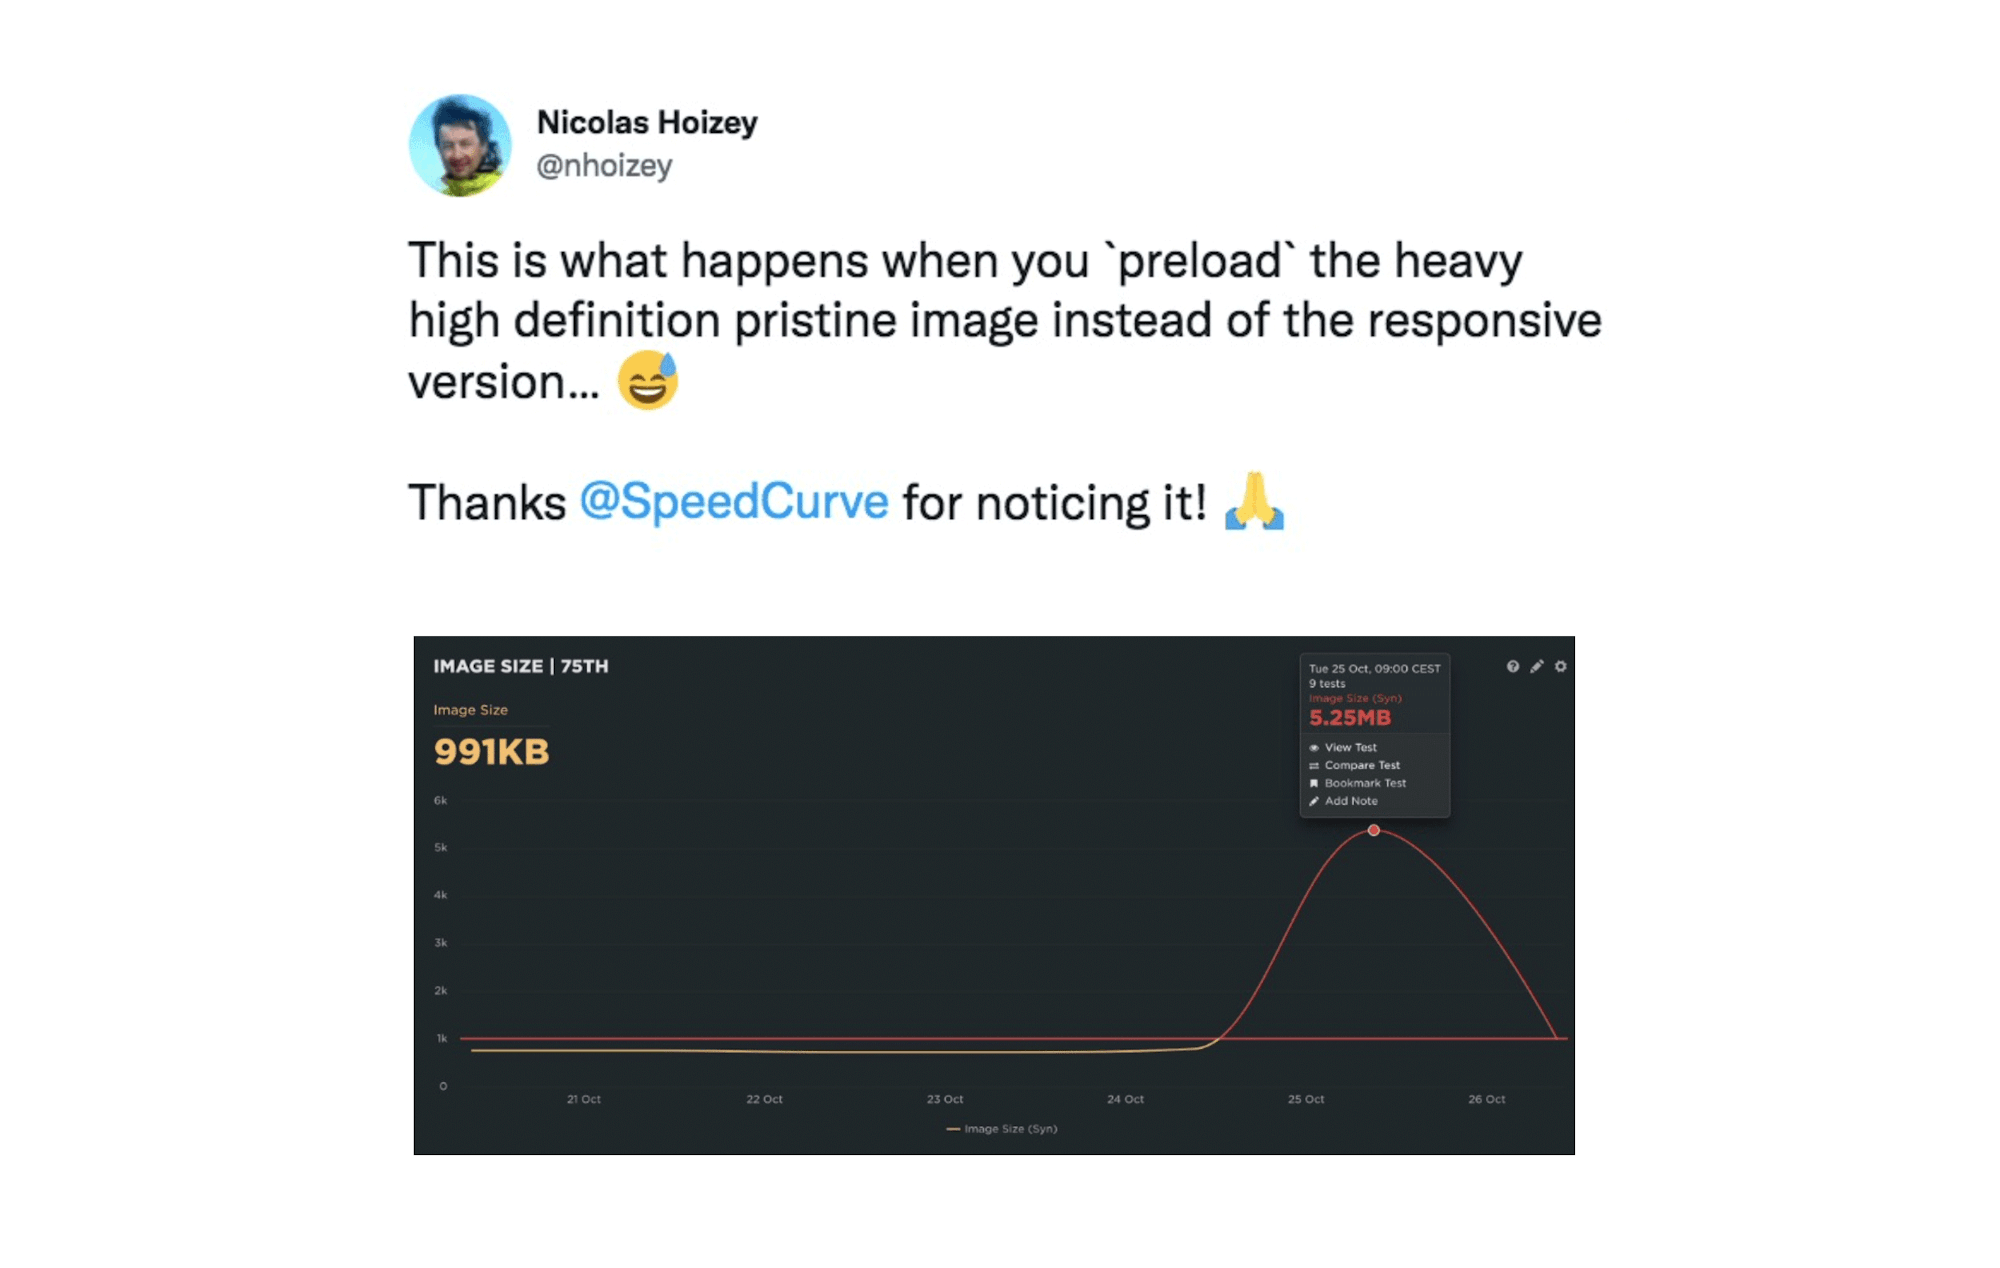
Your site has a number of people contributing content, such as unoptimized images and third-party tags that have the potential to seriously hurt the speed of your pages. You might not know that a new 1MB hero image is suddenly slowing down an important landing page, but the performance budget you created for tracking image weight violations knows.
Now that you understand the "what" and "why", let's talk about getting started with your own budgets.
Get started with performance budgets
6. Which metrics should you start with?
With hundreds of potential performance metrics to track, this is a huge question. While you can (and arguably should) track many metrics across your site, you don't need to set budgets for all of them. In fact, I strongly urge you not to do that.
Instead, I recommend starting with what I call Minimum Viable Budgets.

Even if you create performance budgets for just one or two metrics, that's a great start. That approach lets you:
- Get comfortable with the mechanics of budgets
- Confirm that your budgets are working (i.e., you're catching regressions in a timely manner)
- Teach other people in your organization why these metrics matter
- Avoid alert fatigue
Here are a few metrics to consider, and why:
> Backend (Synthetic and RUM)
Also known as Time to First Byte (TTFB), this is the time from the start of the initial navigation until the first byte is received by the browser (after following redirects). Even if you're not responsible for backend time (e.g., you're a front-end developer), it's a good idea to track it because it can delay all your other metrics.
> Start Render (Synthetic and RUM)
Start Render time is measured as the time from the start of the initial navigation until the first non-white content is painted to the browser display. Even if that first visible paint isn't a meaningful amount of content, it's still a useful signal that the page is working, and it can help stop users from bouncing.
People don't talk much about Start Render these days, perhaps because newer, shinier metrics have emerged. But I've participated in many usability studies that have found a strong, consistent correlation between Start Render and business and user engagement metrics such as conversions and bounce rate.
Other things that make Start Render a must-watch: It's available in both synthetic and real user monitoring tools, and it's broadly supported across browsers. This is hugely important if you care about understanding site speed for all your users, not just certain cohorts.
> Largest Contentful Paint (Synthetic and RUM)
Largest Contentful Paint (LCP) is one of Google's Core Web Vitals. LCP is the time at which the largest visible element in the viewport is rendered. It's only tracked on certain elements, e.g., IMG and VIDEO.
However, there are a number of caveats to using LCP, such as the fact that different elements can be measured for first-time versus repeat views, or for desktop versus mobile views.
Also, LCP is only available in Chromium-based browsers. If you have a significant number of users that come in via other browsers, you should consider tracking Last Painted Hero, below.
> Last Painted Hero (Synthetic)
Last Painted Hero (LPH) is a synthetic metric that's measurable in any browser. (Fun fact: Largest Contentful Paint was partially inspired by Last Painted Hero.) LPH shows you when the last piece of critical content is painted in the browser. It's a handy metric for knowing when all your important content has rendered.
> Cumulative Layout Shift (Synthetic and RUM)
Cumulative Layout Shift (CLS) is another one of Google's Core Web Vitals. CLS is a score that captures how often a user experiences unexpected layout shifts as the page loads. Elements like ads and custom fonts can push important content around while a user is already reading it. A poor CLS score could be a sign that page feels janky to your users.
> Interaction to Next Paint (RUM)
Interaction to Next Paint (INP) is another Core Web Vital. INP measures a page's responsiveness to individual user interactions.
Like LCP, INP is only available in Chromium-based browsers, so if you have a significant number of users that come in via other browsers, you should also consider tracking other responsiveness metrics, such as Total Blocking Time (TBT).
> Total Blocking Time (Synthetic)
Total Blocking Time (TBT) lets you know how much time the various scripts on your page are blocking rendering. Because slow JavaScript is a major cause of delayed responsiveness, TBT is a good proxy for responsiveness metrics like INP.
As a bonus, TBT shows you all the Long Tasks on a page. (More on this below.)
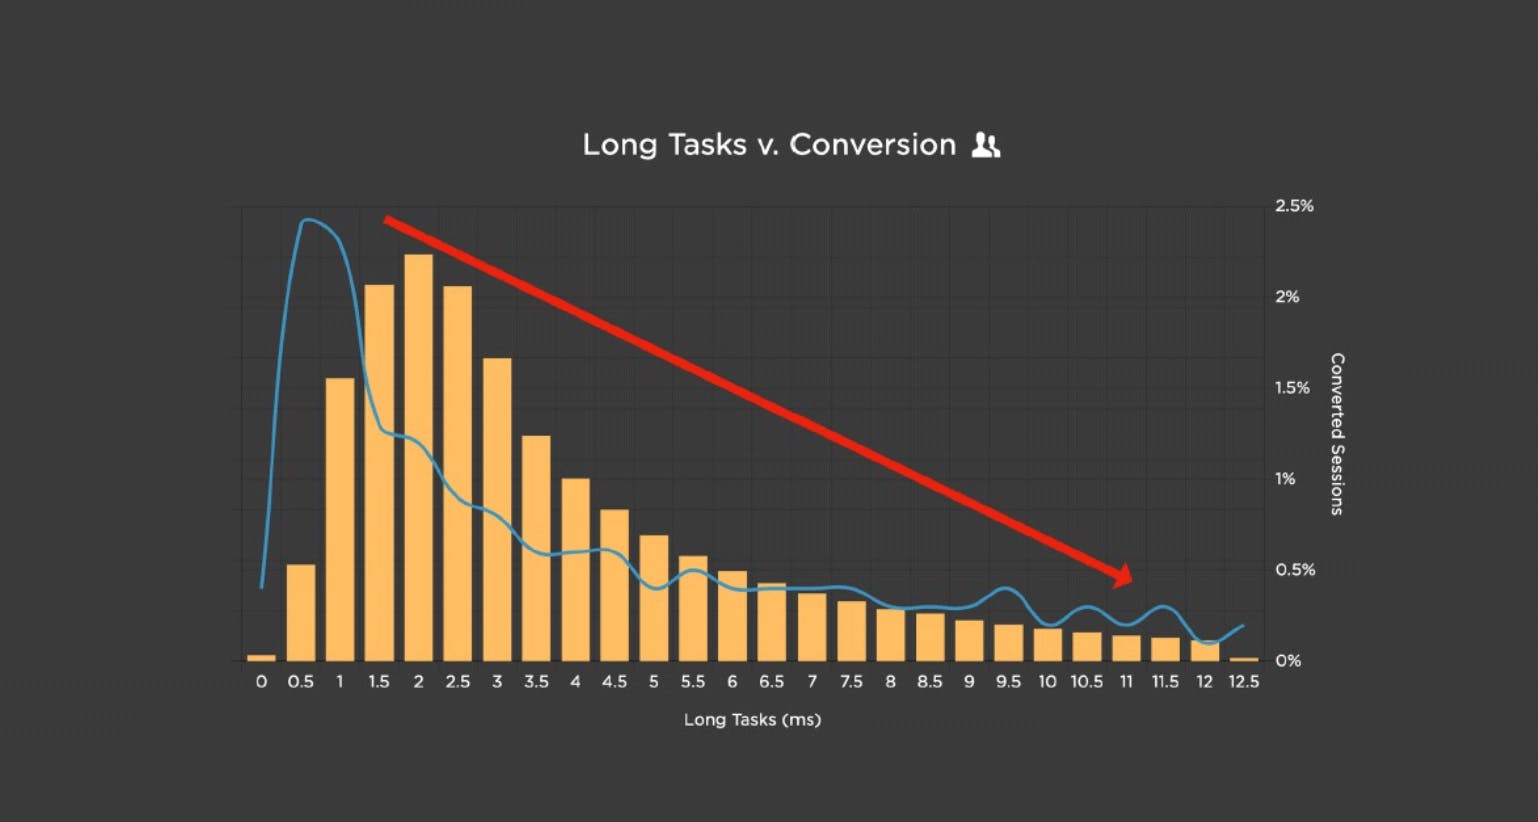
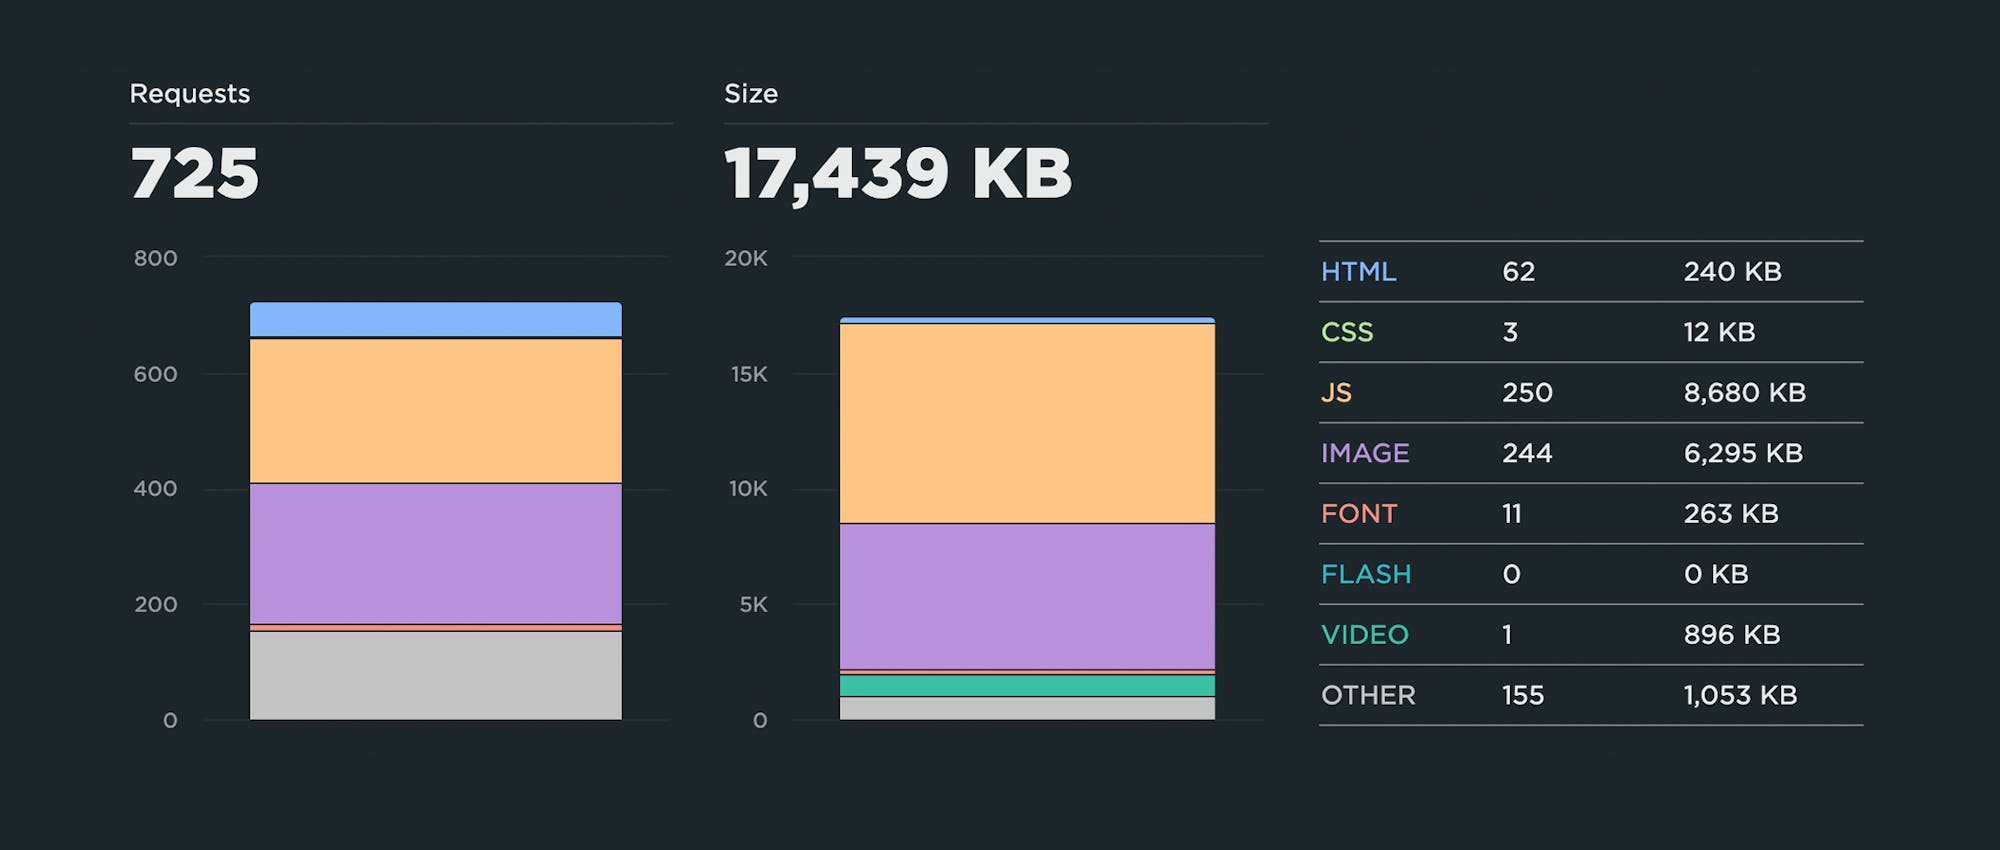
> Long Tasks (Synthetic and RUM)
Long Tasks time is the total time of all your JavaScript tasks over 50ms, from navigation start until the page is fully loaded. Tracking Long Tasks will give you a better understanding of the impact that Long Tasks have on the entire page load and your users.
This can be especially handy if you have a lot of third-party tags on your pages, as third parties can be a heavy contributor to excessive Long Tasks time. Because you're measuring in synthetic, you can also get a detailed list of all the scripts on a page, along with their Long Task times.
And if you're wondering, yes, Long Tasks correlate to business metrics like conversion rate.
> Lighthouse Scores (Synthetic)
Google Lighthouse is an open-source tool that checks your page against rules for Performance, PWA, Accessibility, Best Practice, and SEO. For each of those categories, you get a score out of 100 and recommendations on what to fix. It can be a good idea to track your Performance score to make sure you're not regressing, and then if you do experience a regression, drill down into your audits to identify the cause.
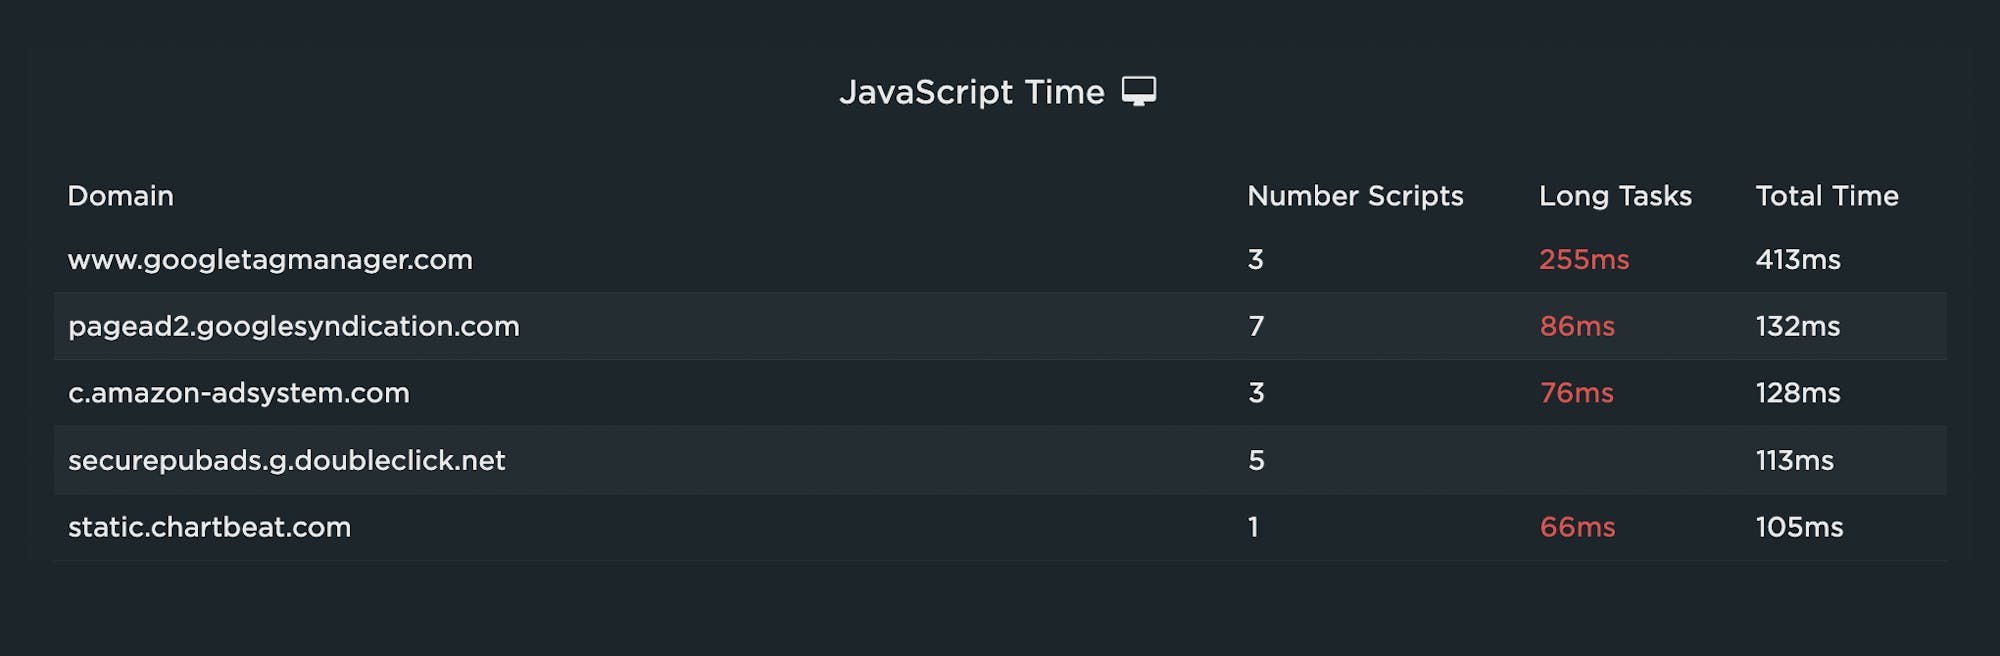
> Page Size (Synthetic)
If you're concerned about serving huge pages to your mobile users, or if you're worried about site contributors accidentally publishing huge unoptimized image and video files, then you should consider tracking metrics like page size and weight.
In an ideal world, pages served to mobile devices would be under 1 MB – and definitely not more than 2 MB – but I often see pages in excess of 10 MB. Media sites are particularly prone to this issue.
Above is a content breakdown for the home page of a mainstream news site. The page contains 725 requests and is over 17 MB in size. Looking at the resource breakdown, I would want to set performance budgets on JavaScript weight (8,680 KB) and image size (6,295 KB). Wow!
> Image Size (Synthetic)
As said, if your pages contain a number of images – and if you have multiple content contributors touching your site – a specific performance budget for image size is a highly recommended guardrail.
> Element Timing (Synthetic and RUM)
Similar to LCP, Element Timing measures when a DOM element is rendered. Unlike LCP, Element Timing allows you (rather than Chrome) to decide which elements you want to measure. And unlike LCP, Element Timing allows you to measure more than one element on a page. (Learn more here.)
Element Timing is a somewhat more advanced metric, so if you're just getting started, you might want to make note of it now and come back to it later, when you're ready.
> User Timing (Synthetic and RUM)
You can create custom metrics to track everything from headlines to call-to-action buttons. Twitter has used custom timers to create a Time to First Tweet metric. Pinterest has created a Pinner Wait Time metric. Using the W3C User Timing spec, you can add timestamps around the specific page elements that matter most to you. (Here's how to add custom timers in SpeedCurve.)
Like Element Timing, User Timing requires some expertise to identify what you want to track and then add the timestamps to your pages, as well as ongoing maintenance. Still, they're worth investigating (if not now, then later) if you have the resources and the need.
7. Focus on key pages
You don't need to apply performance budgets to all your pages. When it comes to the impact of page speed on metrics like conversion rate and bounce rate, some pages are more critical than others.
These are some of the key pages for retail, ranked in order of impact:
- Product detail
- Product category
- Shopping cart
- Home
And these are some key pages for media and other sites:
- Articles
- Search
- Home
Keep in mind that your budgets will most likely vary from page to page, because the performance of your pages may differ widely due to how each page is built.
8. Get buy-in from different stakeholders
Everyone who touches a page should understand the performance impact of changes they introduce to that page. They should also collaborate on setting performance budgets and remediating budget violations.
For example, if your marketing team is responsible for adding and maintaining third-party tags, they should:
- Have a basic understanding of the metrics – such as Long Tasks time – that measure the performance of each tag.
- Collaborate on setting the performance budget – again, based on the worst result over the previous 2-4 weeks – for each metric.
- Receive alerts (typically via email, Slack, or whatever webhook you use) when the performance budget is violated.
- Participate in identifying and fixing the issue (or at least be cc'ed) and get alerted when the budget has been resolved.
In SpeedCurve, you can set up separate dashboards for each stakeholder group in your organization. You can create charts and performance performance budgets within each dashboard, and then configure alerts to be sent only to specific stakeholders.
Below is an example of a dashboard created for an SEO team. It focuses on the Lighthouse SEO score, as well as Largest Contentful Paint, Interaction to Next Paint, and Cumulative Layout Shift, as those are both Core Web Vitals and therefore important search ranking factors.
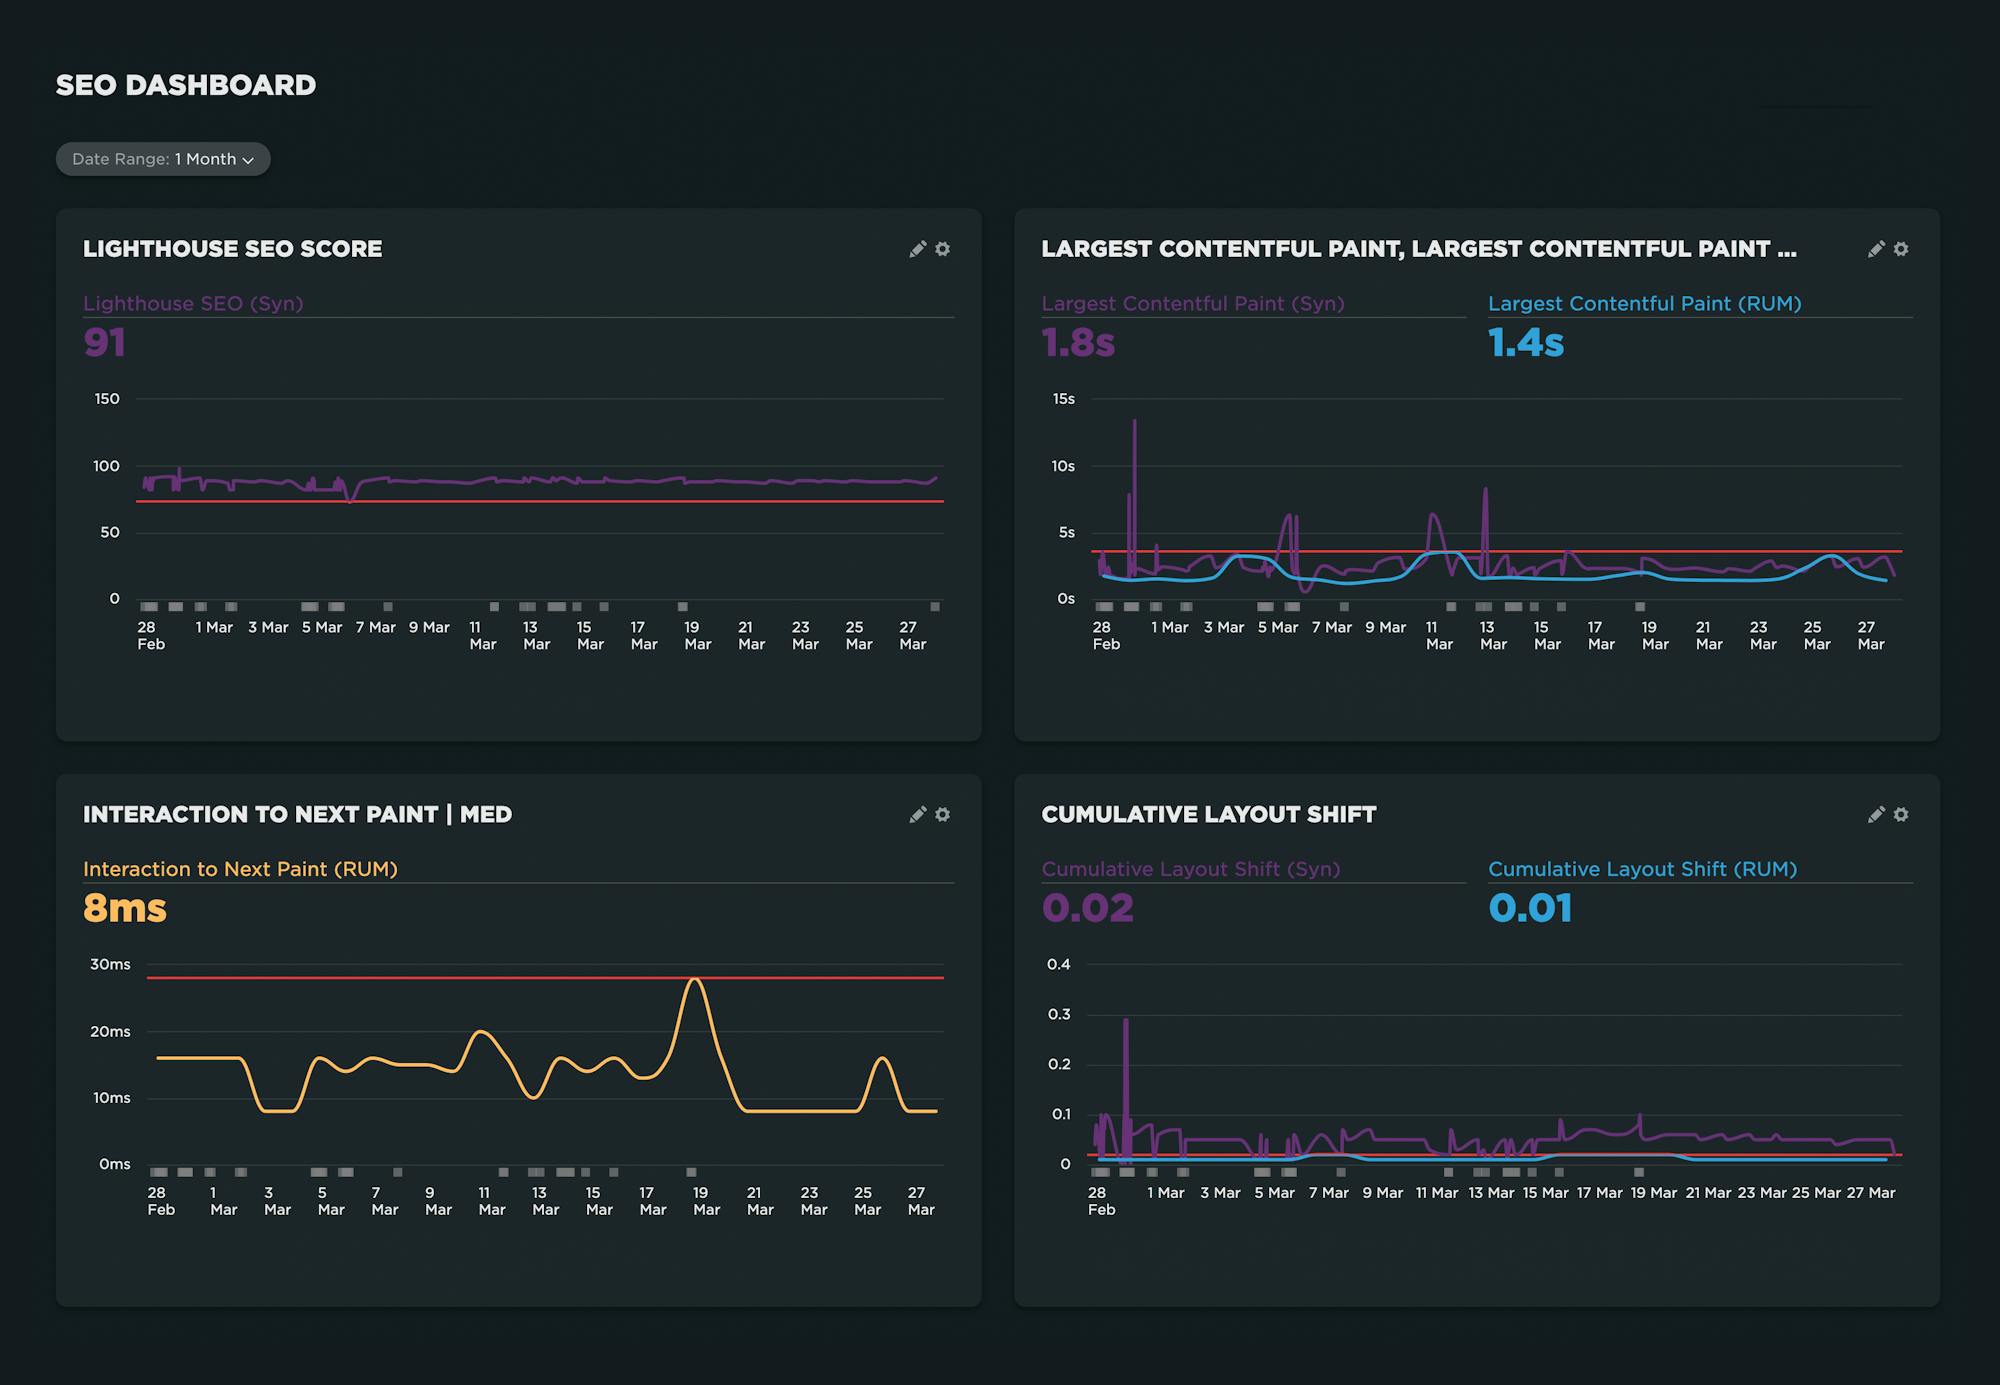
A couple of things to note:
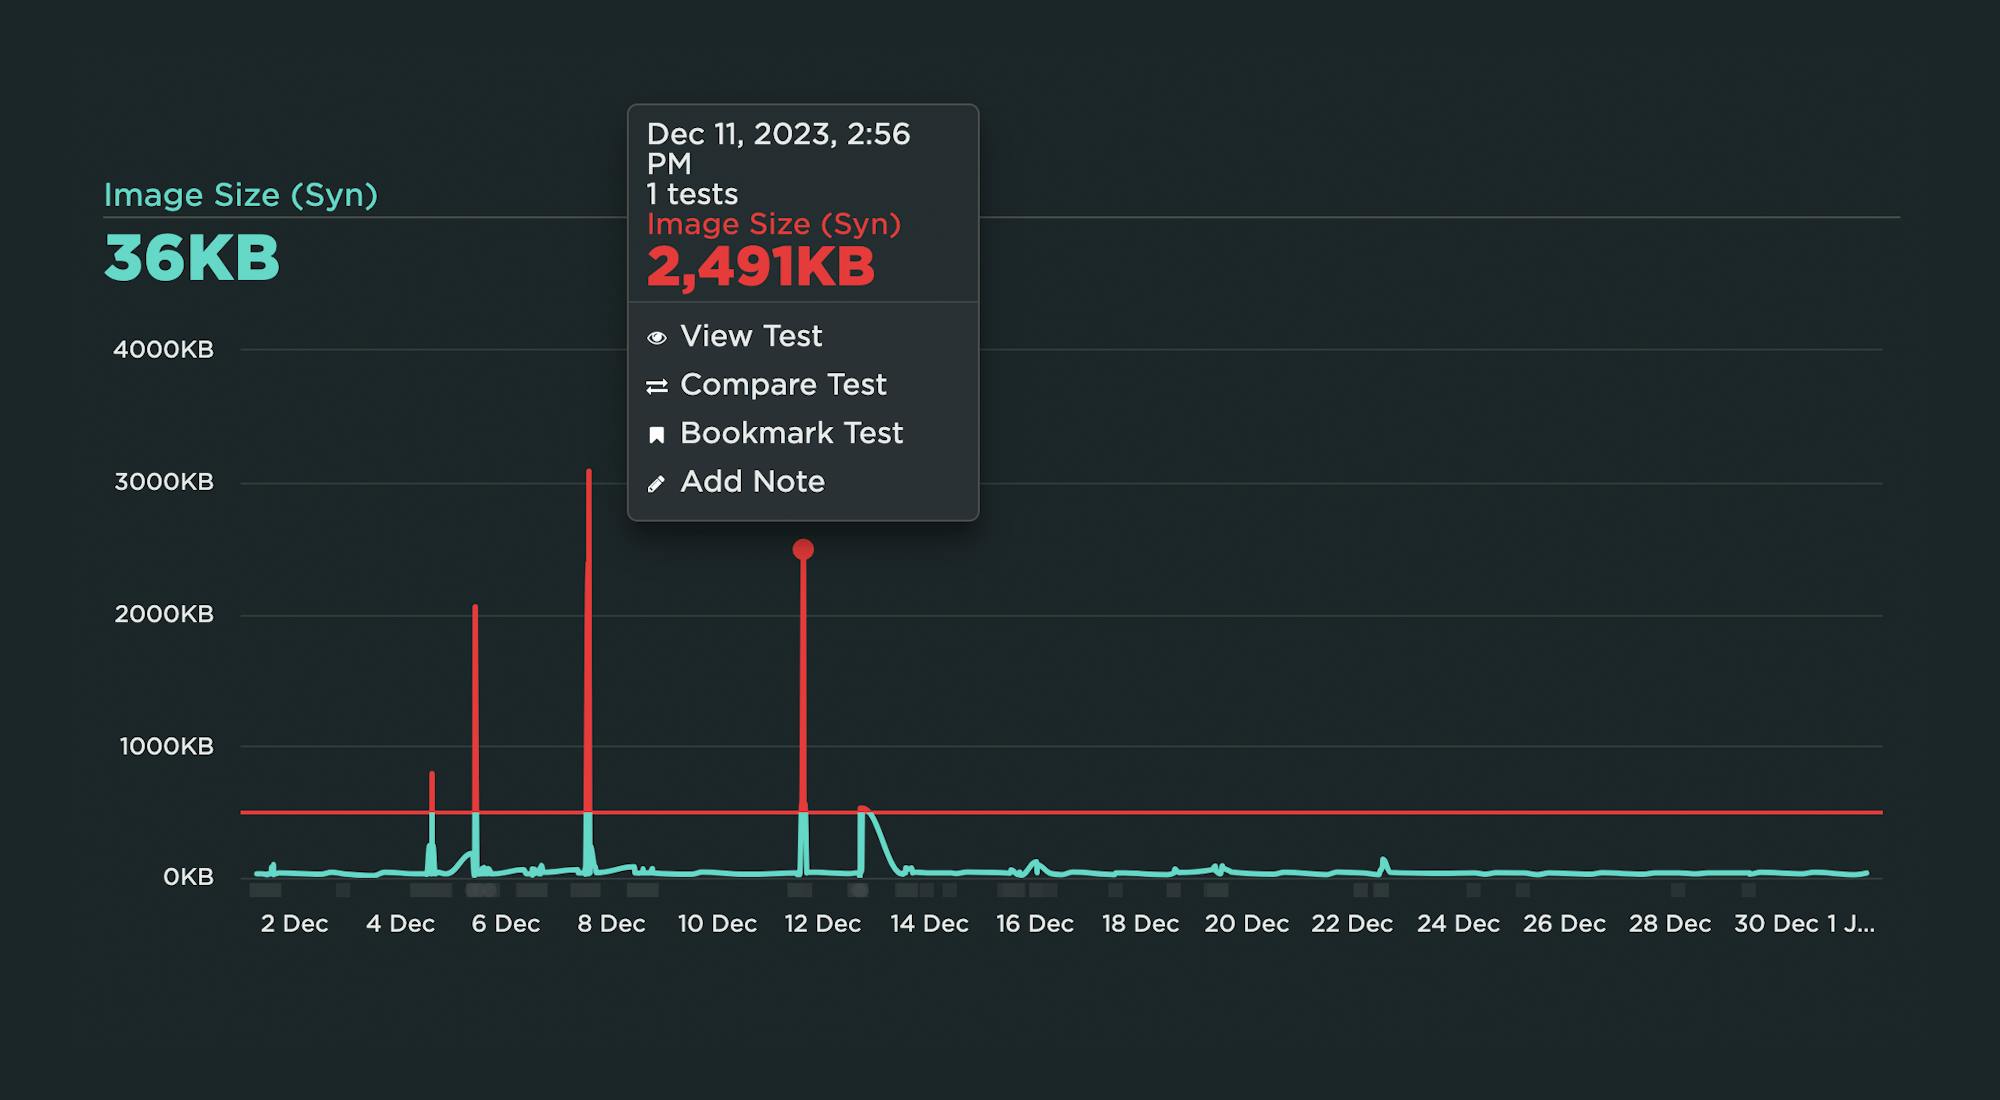
- For any metrics that are measurable in synthetic and RUM, it's helpful to track them in the same chart. Set the performance budget on your RUM metric so you get an alert when the budget is violated. Then drill down into the synthetic test data to identify and fix the issue. (More on this further down in this post.)
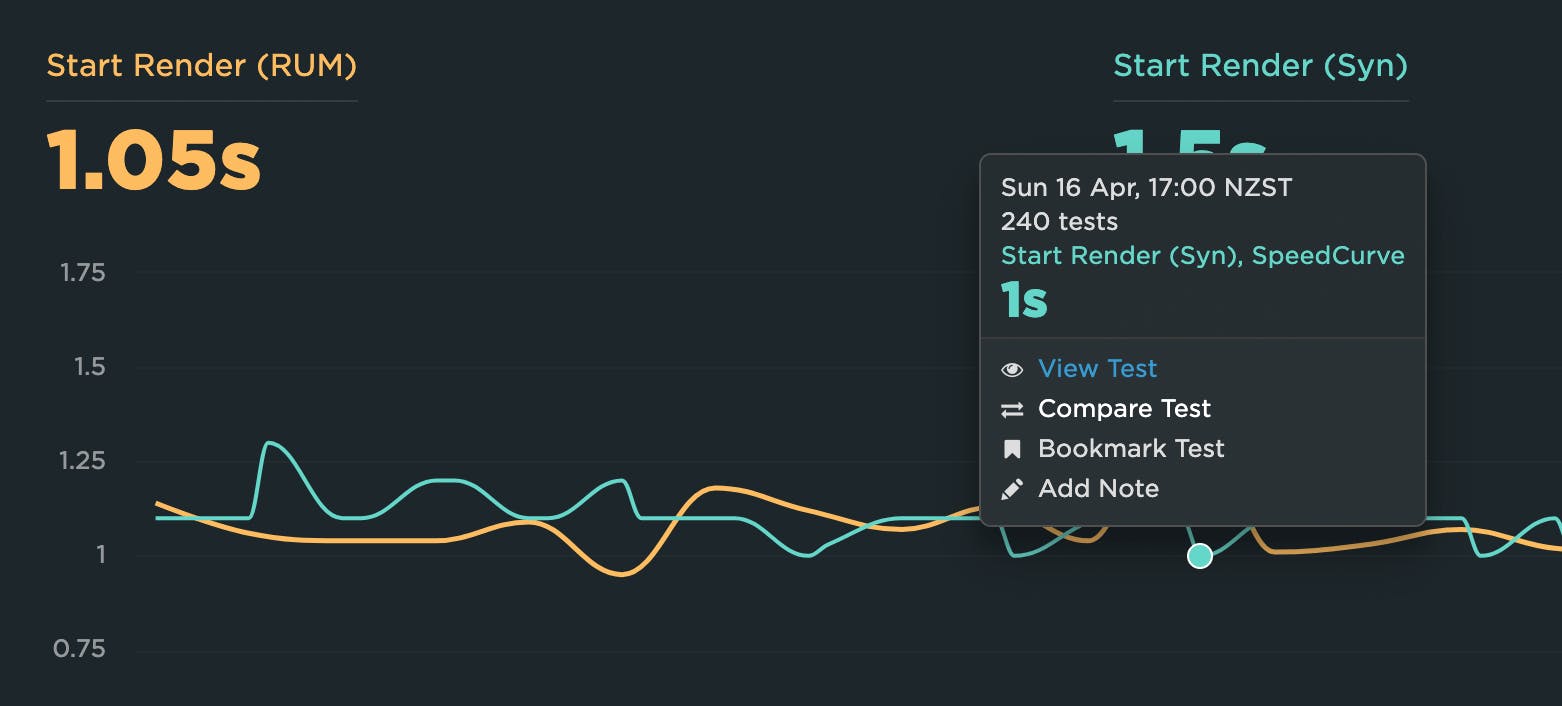
- In any of the charts where synthetic test data is collected, you can click on any data point to drill down into your test details where, among other things, you can get detailed audits that recommend what you can fix on the page.
9. Use synthetic testing to visually validate your metrics
The metrics mentioned above are not hard-and-fast suggestions. That's because a metric that is relevant and helpful for one page may not be helpful for another. Before you invest the time and energy in setting up performance budgets for a metric, first take a good look at how that metric aligns with your own data.
The easiest way to validate your metrics is to look at rendering filmstrips in your synthetic test data, like this:
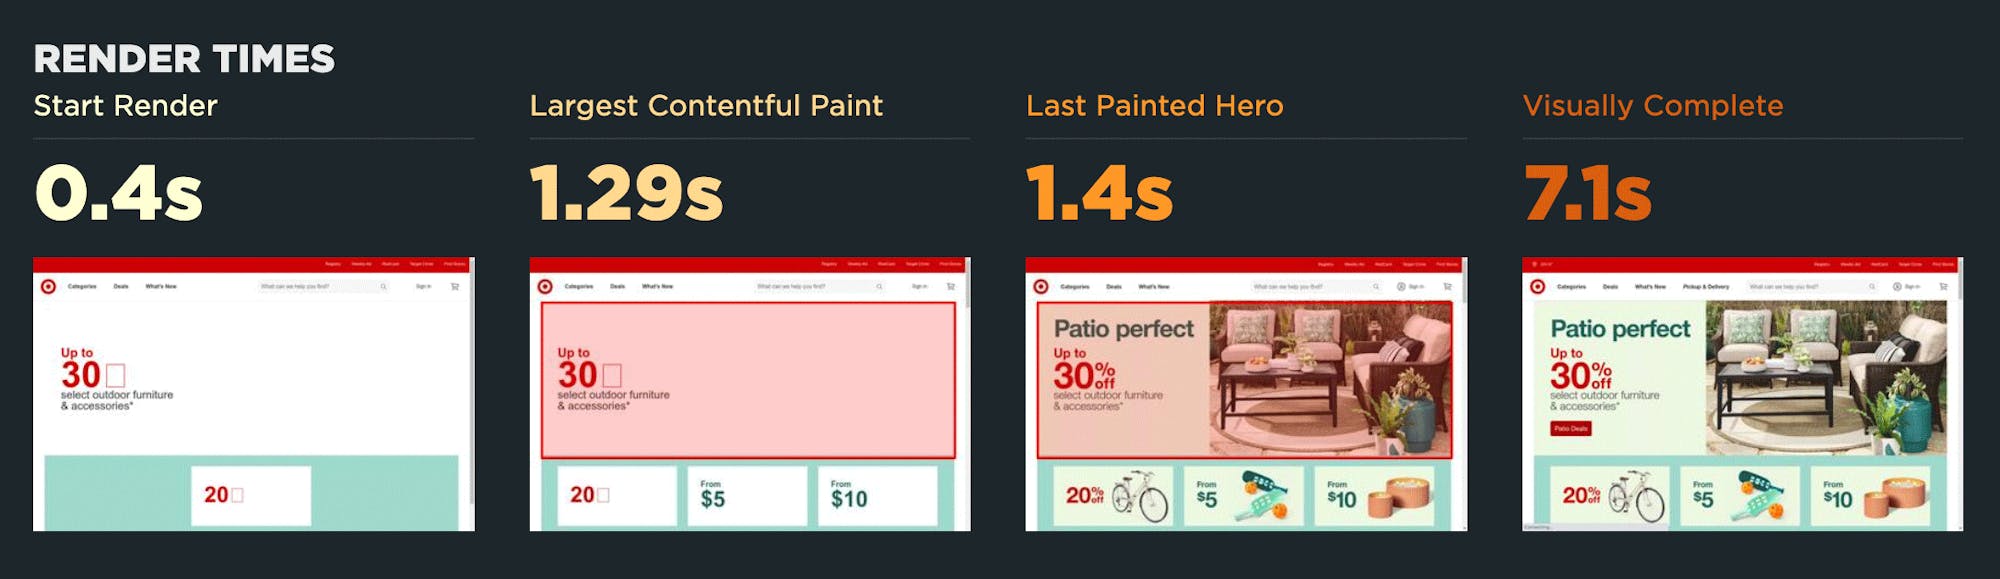
In the example above (taken from our Industry Benchmarks) you can see:
- Start Render does correlate to content appearing in the viewport.
- Largest Contentful Paint doesn't quite align with the appearance of the largest image.
- Last Painted Hero, on the other hand, does align with the largest image.
- Visually Complete comes in much later and arguably isn't helpful for this page.
Based on these observations, you might choose to focus on Start Render and Last Painted Hero.
If you need to validate more metrics, you can look at your waterfall chart and see how the various metrics line up with the rendering filmstrip, like this:
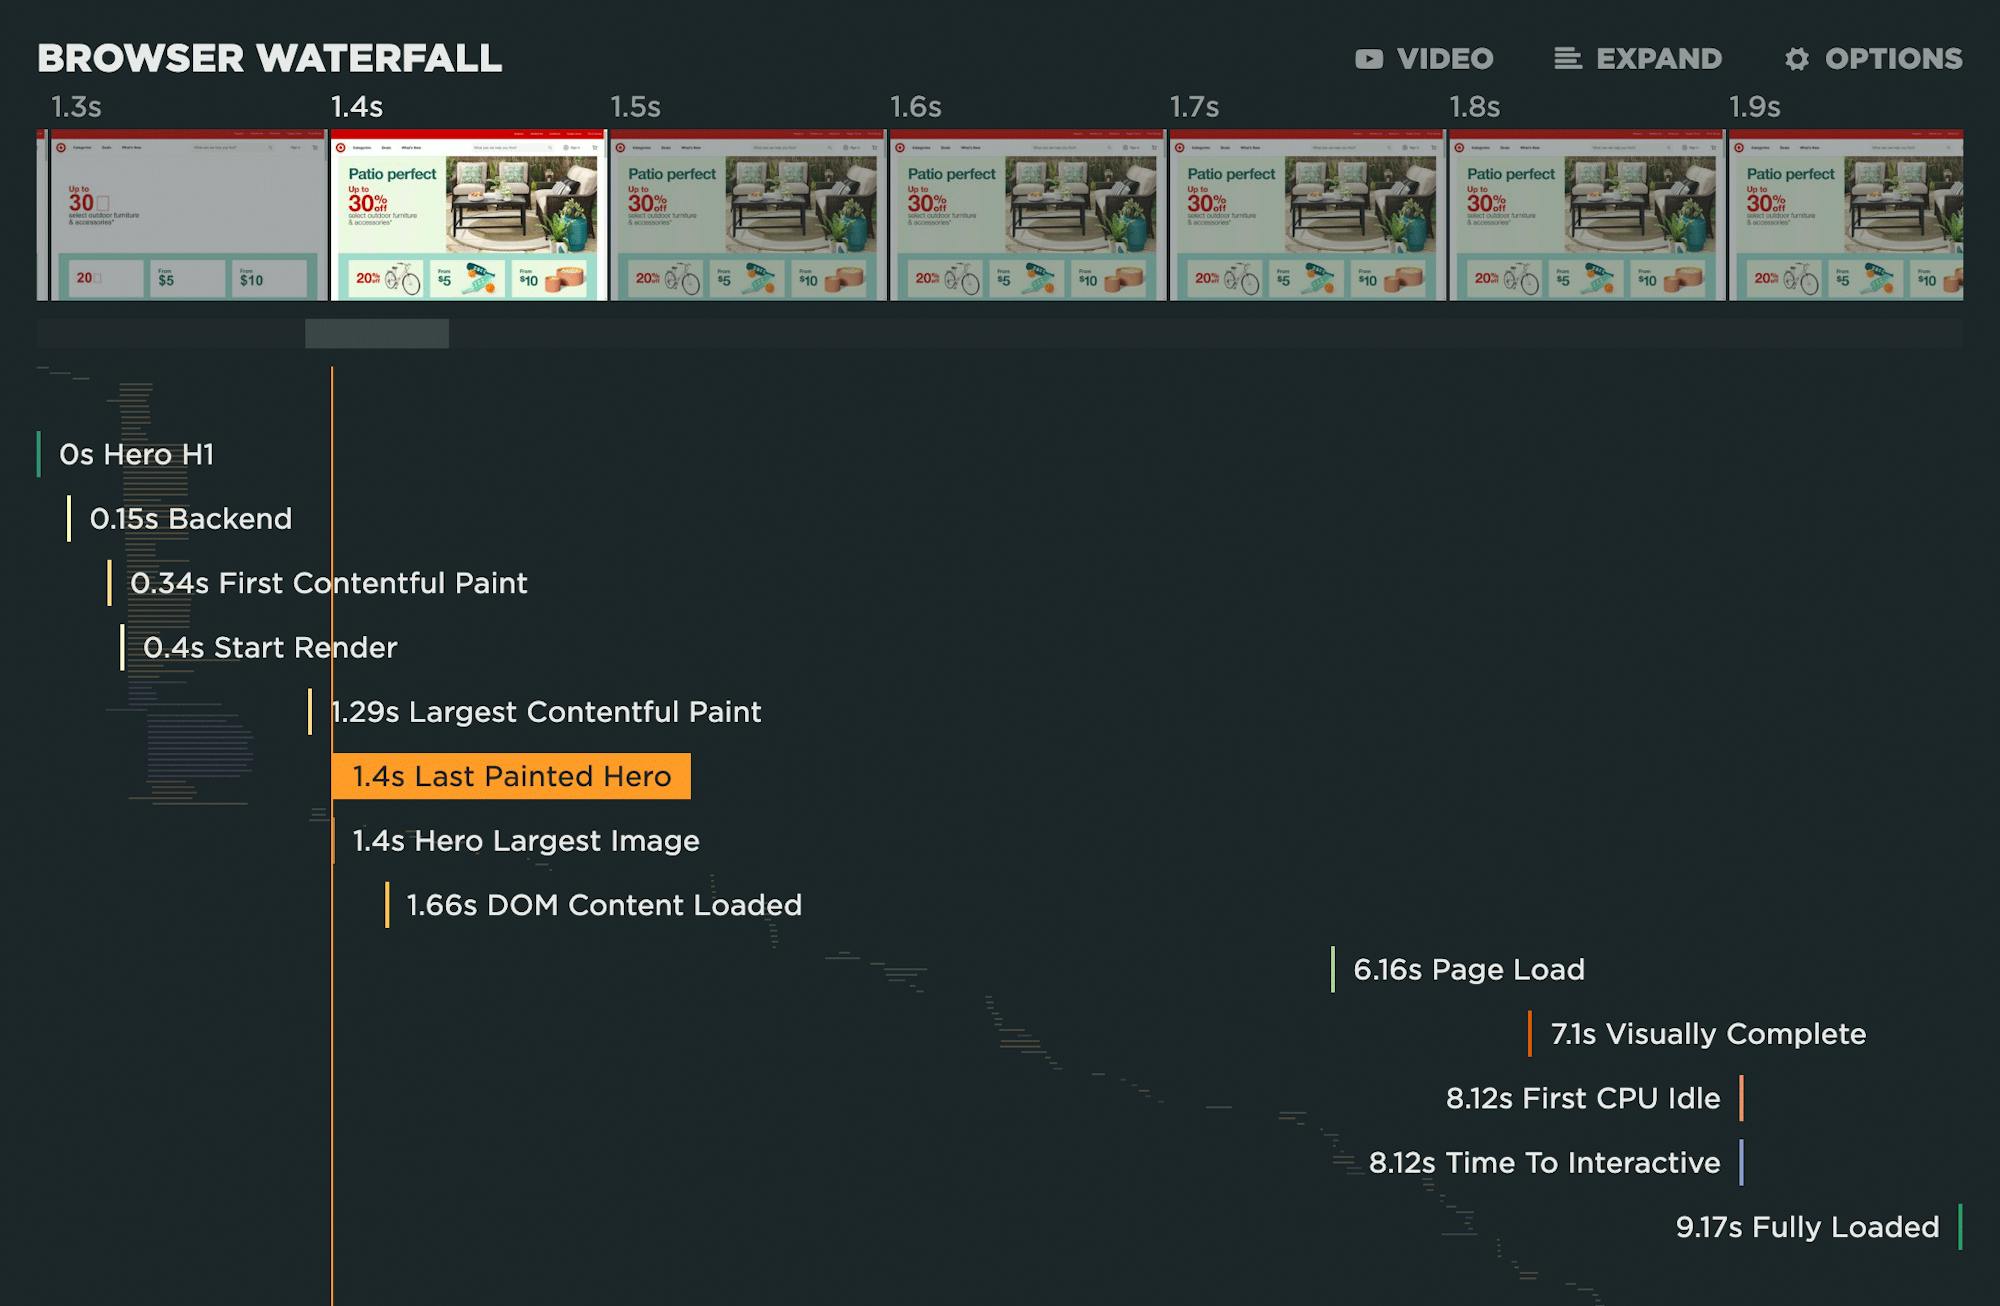
Using this view, it's relatively fast and easy to see which metrics work or don't work for a given page. It's important to keep in mind that just because a metric isn't relevant for one page, that doesn't necessarily mean it's a bad metric. Often, any variability you might see is due to how the page is built.
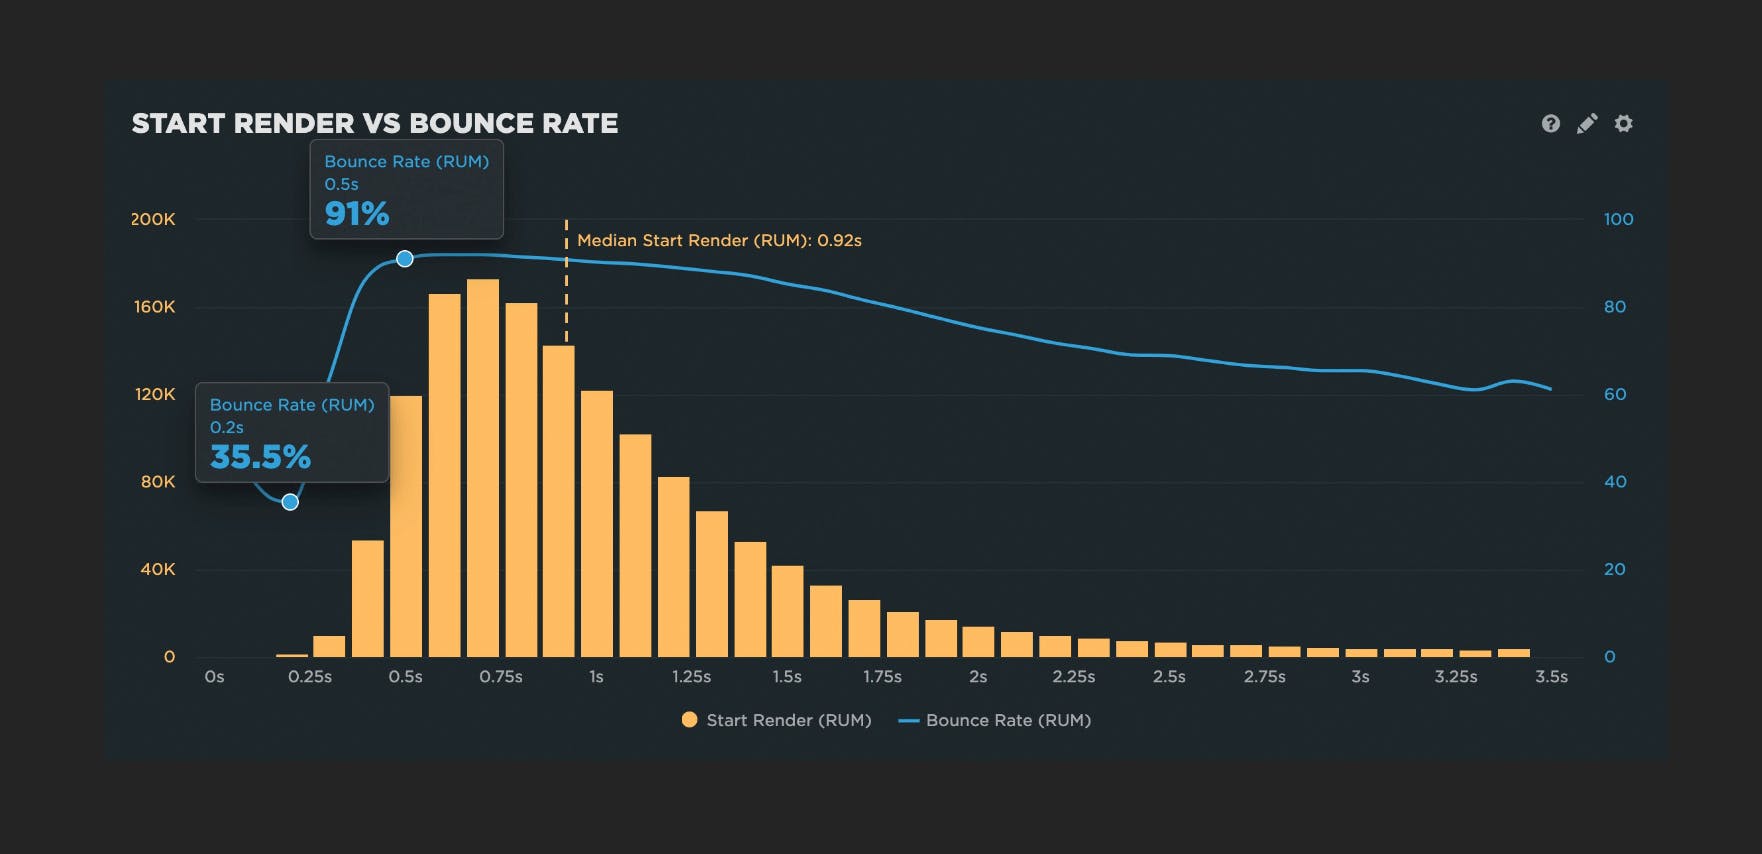
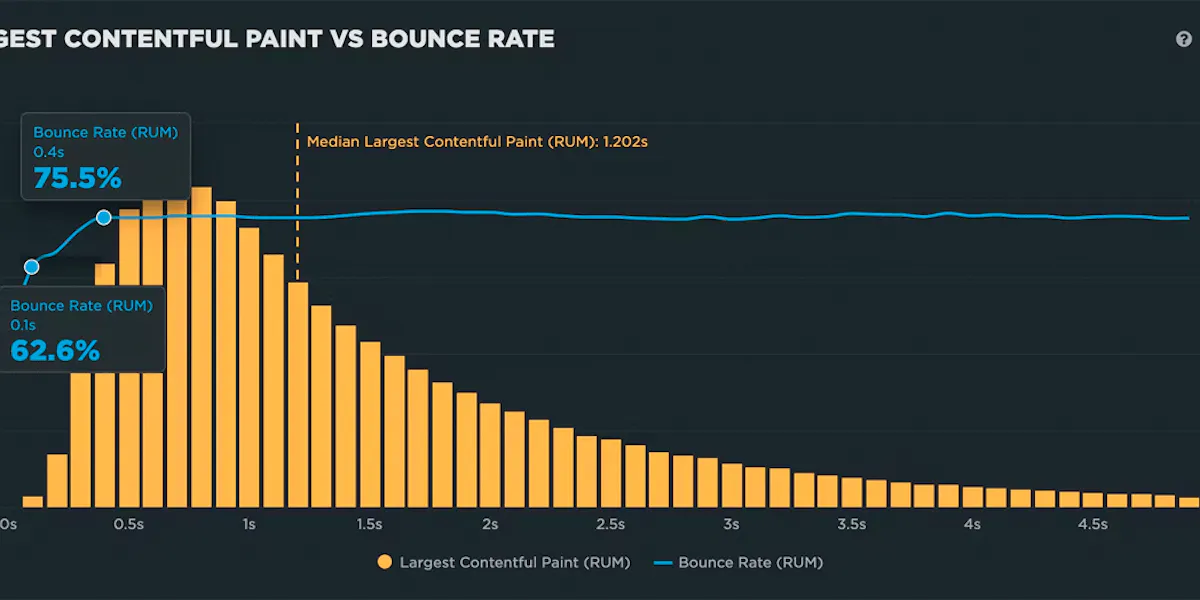
10. Use real user monitoring to validate user engagement and business impact
This is a good way to give yourself the confidence that you're tracking the right metrics. Ultimately, you want to know that changes you make to your site – for better or for worse – will directly affect user behaviour and business outcomes.
This is where real user monitoring (RUM) really shines. RUM can track data about bounce rate and conversion rate (along with other user experience and business KPIs). Using this data alongside your performance data, you can create correlation charts that demonstrate the relationship between performance and business outcomes.
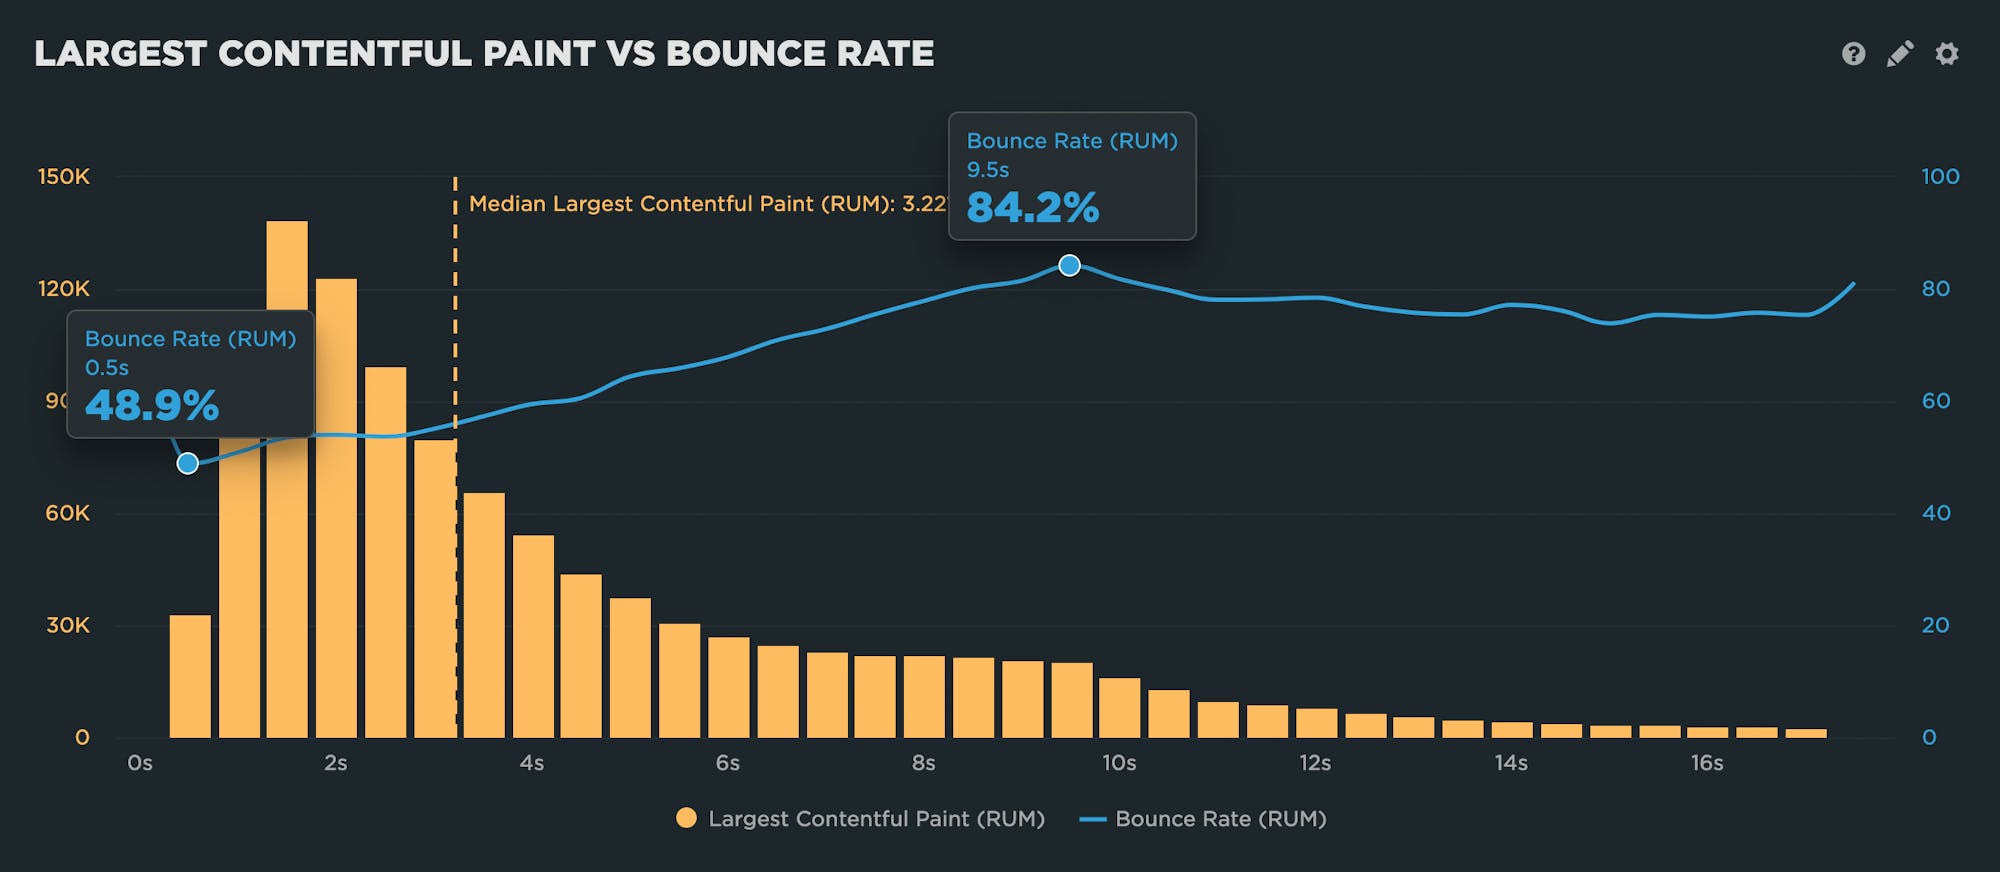
In the correlation chart above, you can clearly see that as LCP times get slower, bounce rate gets worse. This chart demonstrates that, for this particular site, LCP time is a good metric to set a performance budget for.
11. Synthesize your synthetic and real user monitoring data
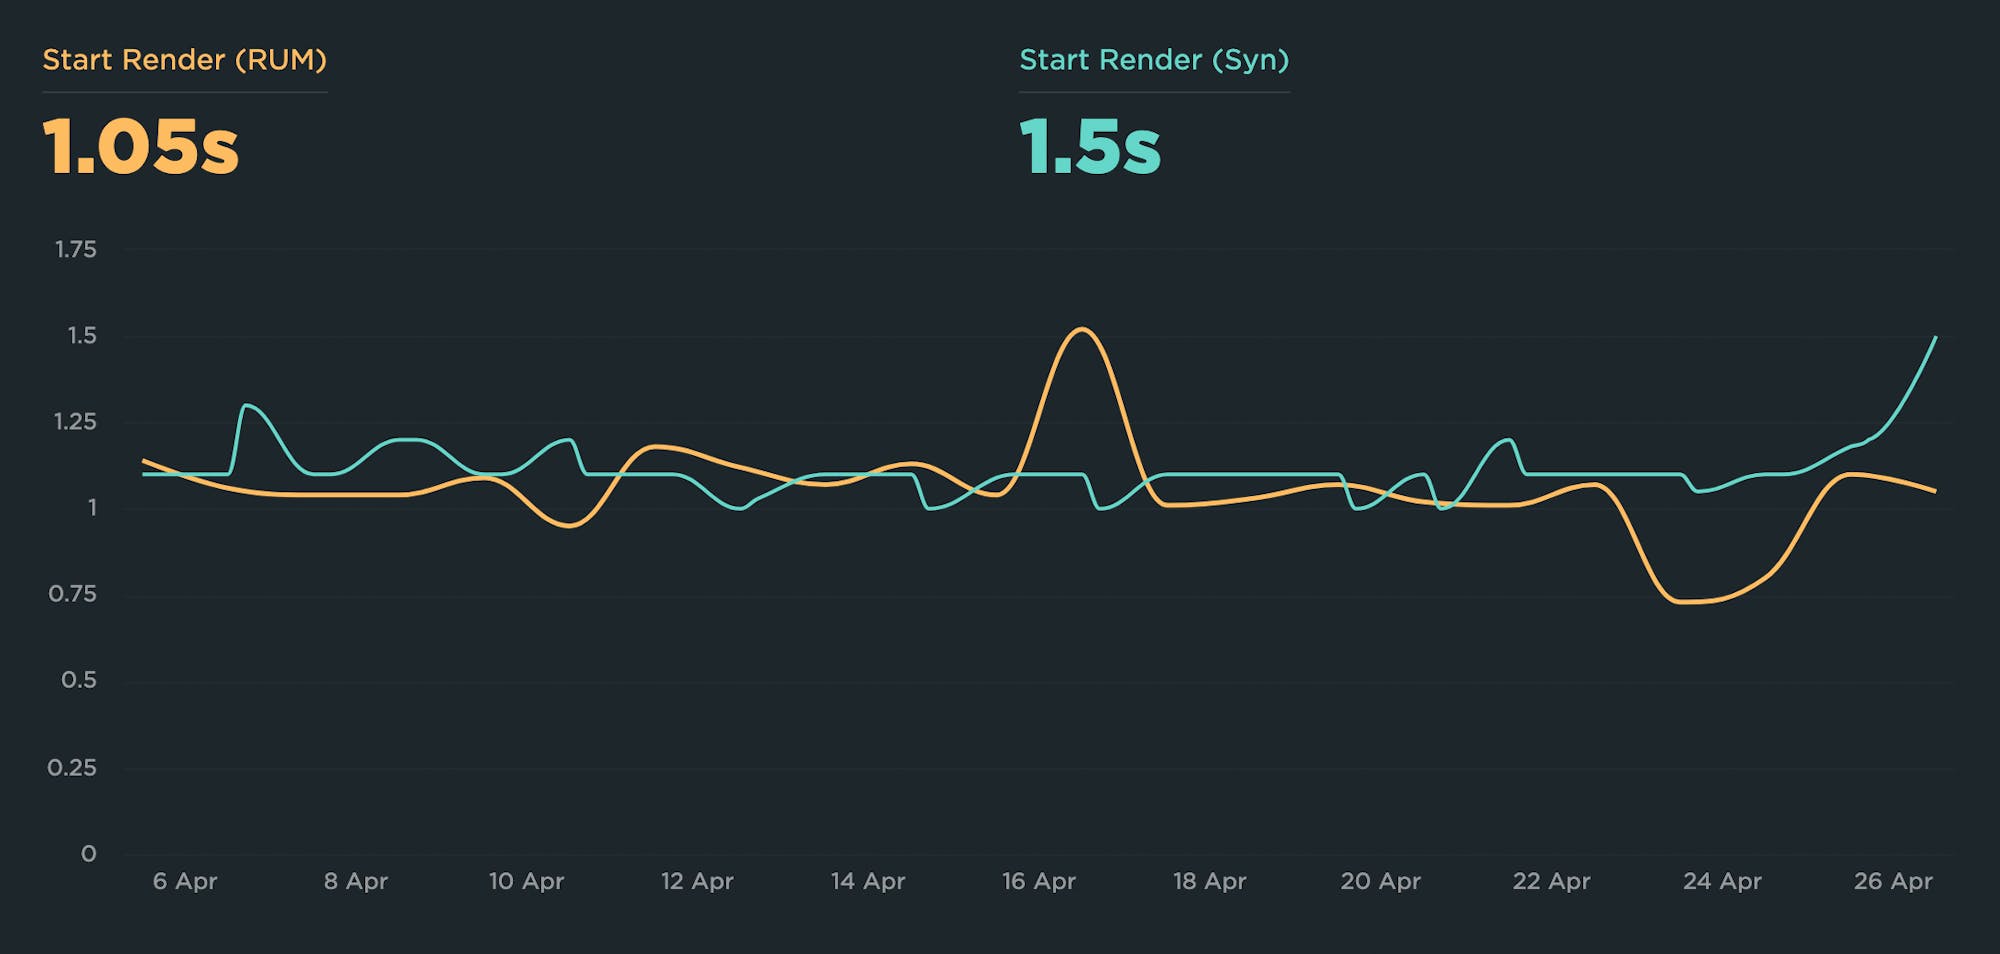
In an ideal world, you're using both synthetic and real user monitoring (RUM). Several metrics are available in both tools, so you can create charts in which you track the same metric in both synthetic and RUM.
(It's important to know that your synthetic and RUM metrics most likely will not match, for reasons explained here. This is nothing to be concerned about. The important thing to track is consistency and changes within a single tool and settings.)
For a metric that's available in synthetic and RUM, such as Start Render or Largest Contentful Paint, you might want to consider this type of setup:
> Track the metric for synthetic and RUM within the same chart.
> Create the performance budget for the RUM metric, so you get an alert when the budget is violated. This lets you know that real users are experiencing this issue.
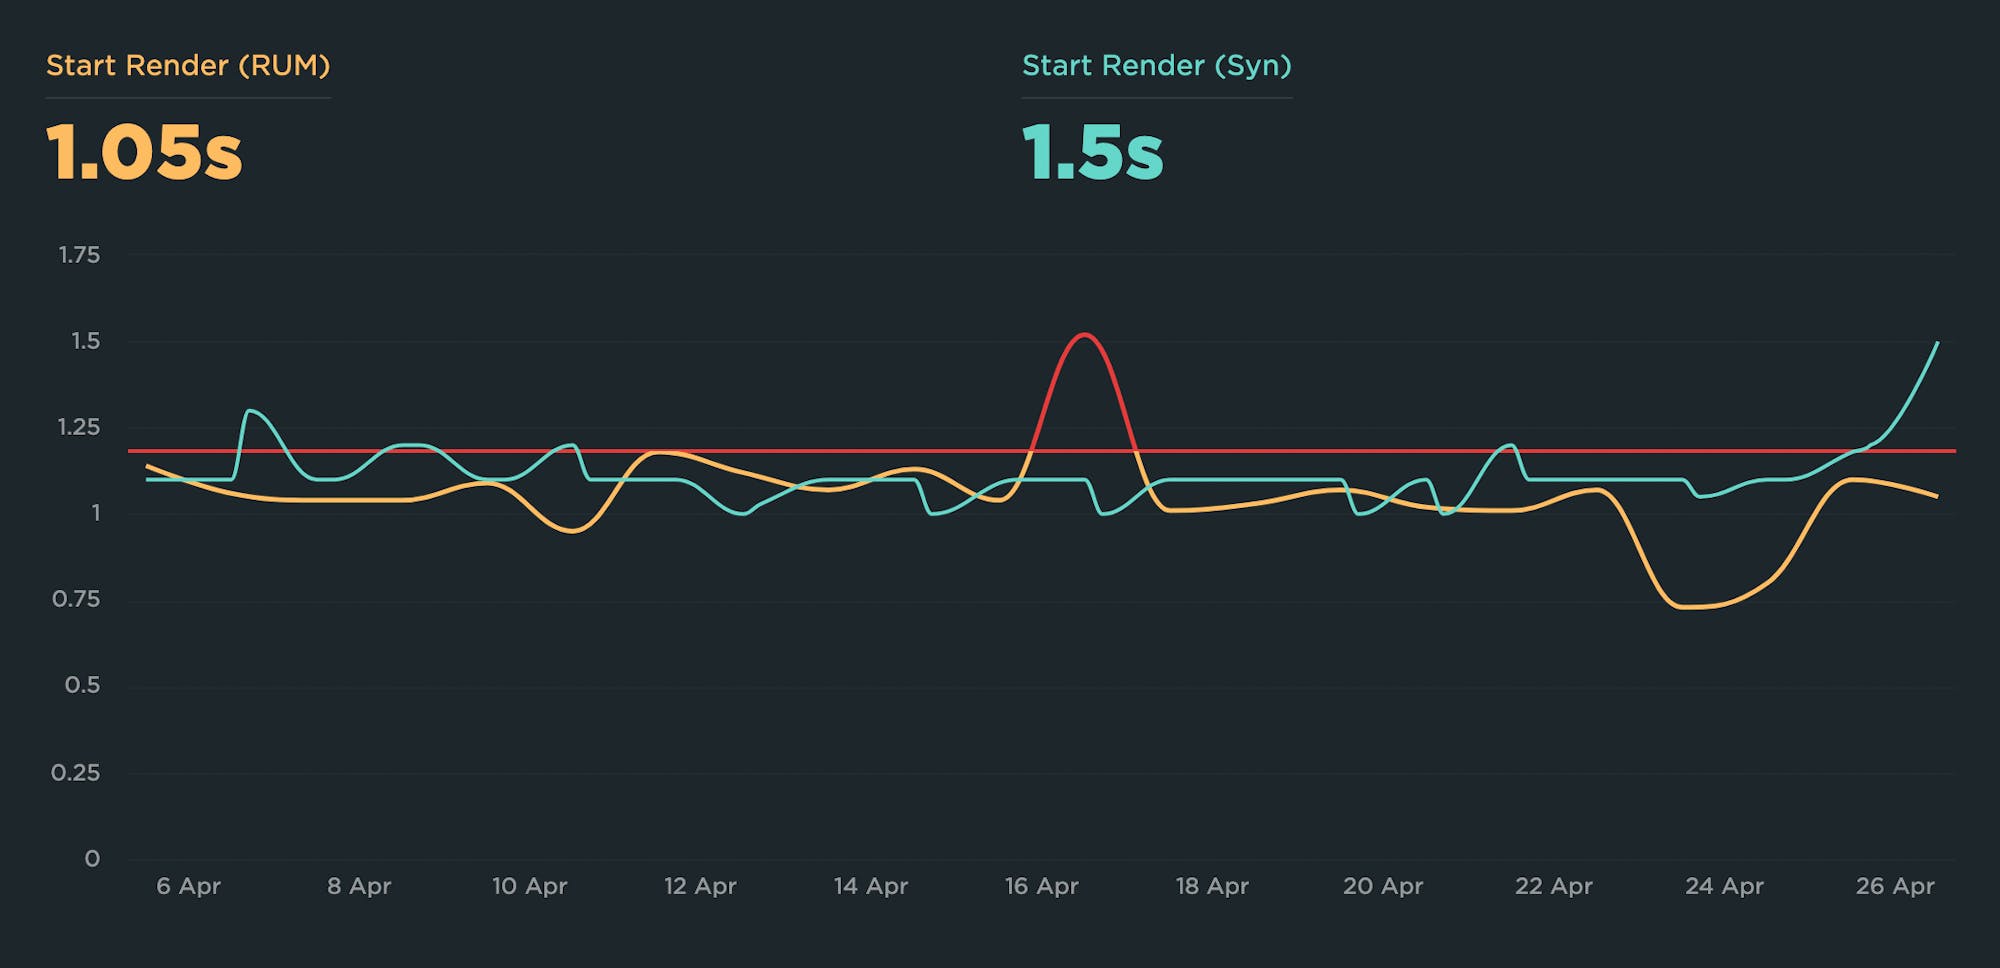
> Because you're tracking synthetic data in the same chart, you can easily drill down and get detailed test results and diagnostics.
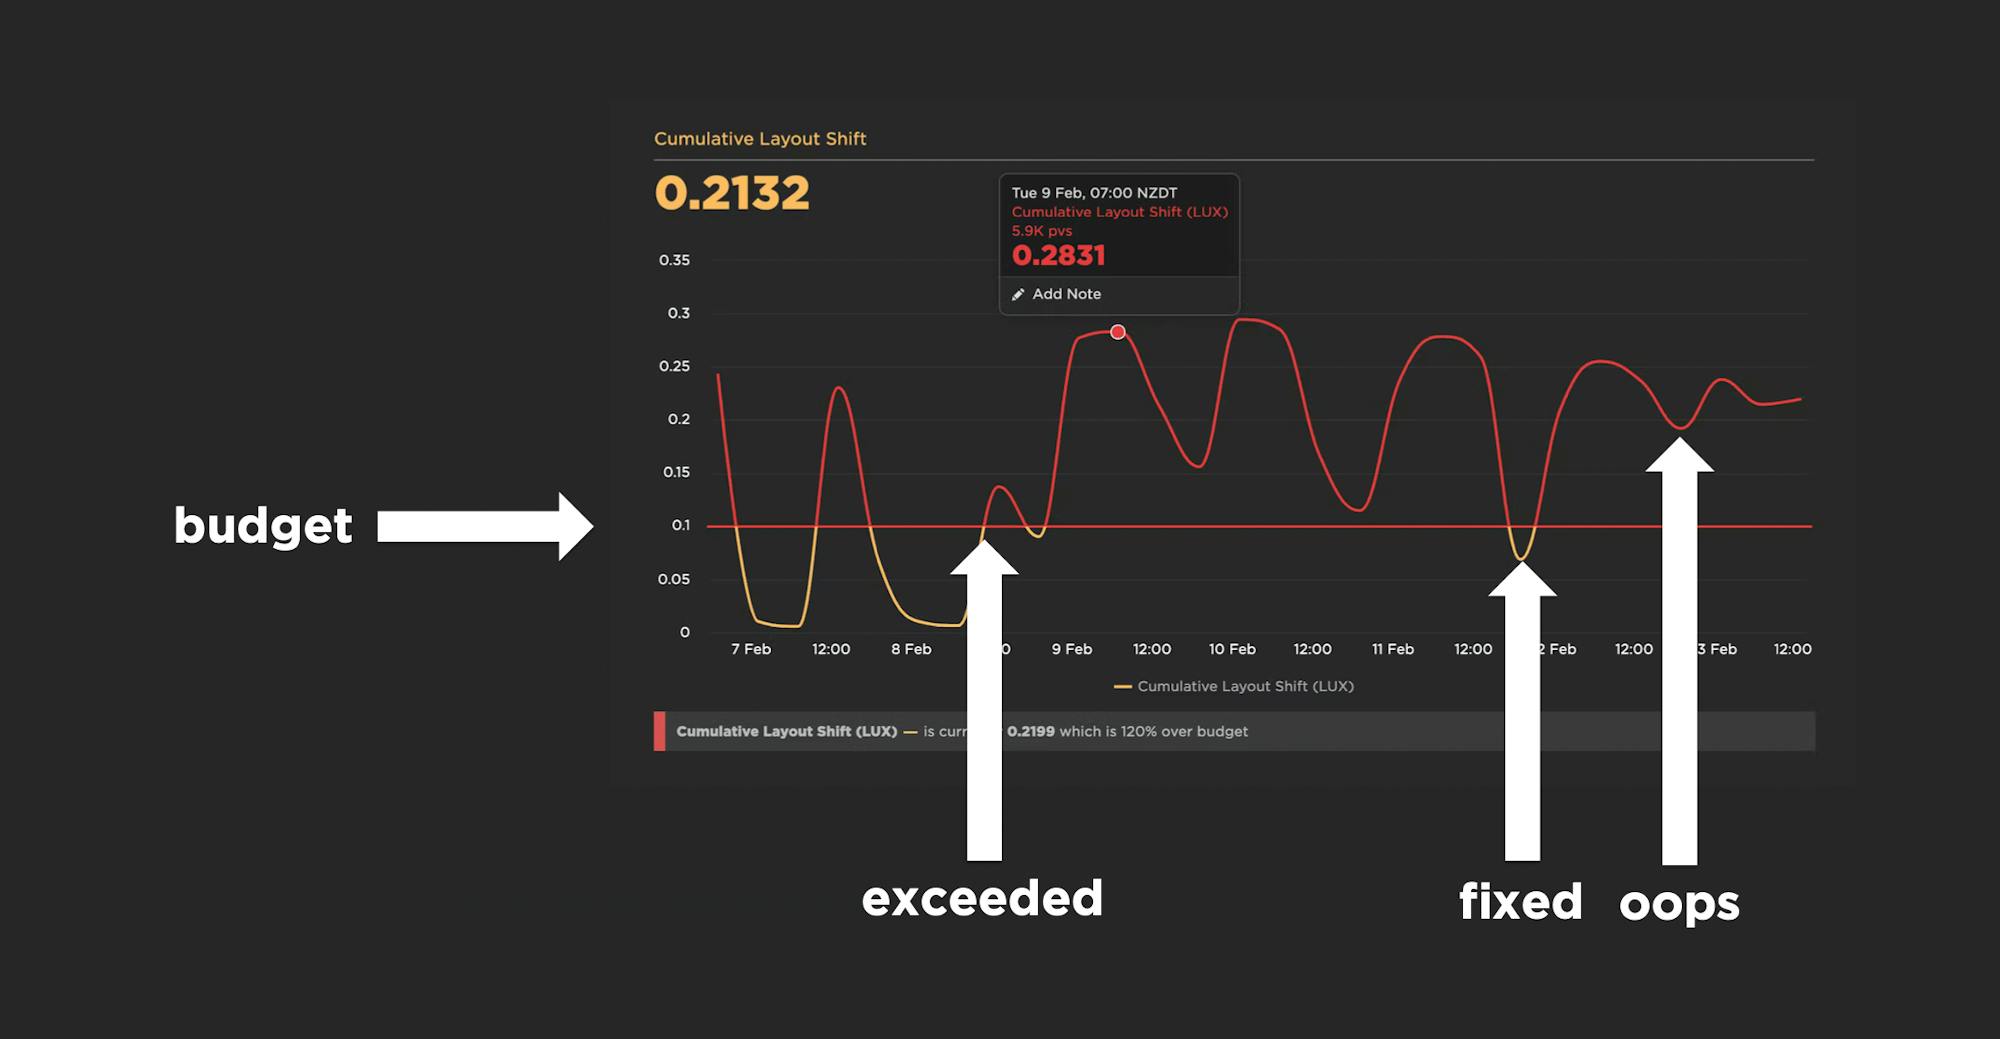
> Add a note to the chart, stating when you implemented the necessary fixes. After your fixes go live, you can see (and get an alert) when your metric returns to normal.

This is just one potential configuration. If you're using your RUM and synthetic data in other ways, I'd love to learn more about it!
12. Set up alerting (but not too much!)
Avoiding alert fatigue is crucial to the success of your performance budget strategy. If you're just starting out, it's absolutely fine to focus on just a handful of metrics. You can create performance budgets for all of them, but if you're setting up alerting, focus on just setting up alerts for critical metrics such as:
- Backend Time
- Start Render
- Largest Contentful Paint
- Image Size
13. Integrate with your CI/CD process
You can integrate your performance budgets and alerts with your CI/CD process. This gives you the ability to do a few of things:
- Run synthetic tests in your staging/development environment and get alerts if any changes you've introduced have caused budget violations before the page goes live. You can even opt to break the build if any of your budgets are violated.
- Run tests each time you do a deploy, catching issues immediately after they go live.
- Run tests against GitHub pull requests, so you can test the performance of your PRs before they're merged.
Keep your budgets relevant
Your budgets will ideally change over time, as your various metrics (hopefully) improve. After you've taken the time to create your performance budgets, you want them to stay relevant and helpful.
14. Update your budgets
If you're taking the practical, iterative approach recommended above, then you should revisit your budgets every 2-4 weeks and adjust them (hopefully downward) accordingly.
You should also periodically revisit your metrics – going through the validation steps described in steps 9 and 10 above – to make sure you're still tracking the right things go through the validation Are you still tracking the right metrics?
15. Celebrate wins!
If you consistently improve a metric and have just updated your budget, share your charts and let your teams (and your boss!) know. It's important to celebrate even small wins, because big wins are rare. Performance improvement is cumulative. Getting faster should always be celebrated!

Case studies
Here's how some of our customers have used performance budgets to stay fast:
- Improving Cumulative Layout Shift at The Telegraph
- How Farfetch built a performance culture at scale
- Crafting Faster Themes at Shopify
- Building a mobile-first and performance-first culture at Vox Media
- How GOV.UK uses performance budgets to keep their site accessible
- Holiday Extras tackles SPA performance at scale
- Zillow Gets Bigger, Faster, and More Engaging While on a Budget
- How performance budgets help Wehkamp keep a highly performant website
- Fostering a web performance culture on leroymerlin.fr
More resources
If you're a SpeedCurve user, these resources will help you get started with performance budgets. If you're not using SpeedCurve yet, signing up for a free trial is easy!
- Create performance budgets and alerts
- See all your performance budgets at a glance on your Budgets Dashboard
- Integrate your synthetic testing into your CI/CD environment
- Track individual first and third parties
- Get started with Core Web Vitals
(This post has been updated from an earlier version published in May 2023.)

Read Next
Have you ever wondered why your site got faster, but your business and user engagement metrics didn't change? Here's why.

Performance isn’t something you fix once and walk away from. Continuous monitoring - using performance budgets in your CI/CD workflow - helps you fight regressions and stay fast.