
Firefox Developer Edition 44, released last week, includes a brand new memory tool to help you understand how your web applications are using and retaining memory. This is especially useful for developers targeting the mobile web, and thus working with constrained resources. Baptiste Kaenel, a freelance Creative Designer and Mozilla community member from France, put together a fantastic video demonstrating how to use this powerful new tool.
The Memory tool works by taking snapshots of everything in memory, and presenting them as a tree/table with various grouping settings. By default, the contents are grouped by “coarse type,” where each thing in memory falls into one of four classifications:
- Objects: JavaScript objects. Further grouped by each object’s internal [[Class]] name.
- Scripts: The JavaScript source text loaded by the web application and its resulting executable machine code produced by SpiderMonkey’s JIT compiler, IonMonkey.
- Strings: JavaScript strings used by the web application.
- Other: Miscellaneous structures that do not fit in the above categories.
You can also group the snapshot by “object class,” which groups by their JavaScript [[Object]] class, or by “internal type,” which groups things by their C++ type names. This latter view is mostly useful for Firefox platform developers.
Perhaps most interesting is the fourth and final grouping option: “allocation stack.” You have to turn this option on manually by ticking the “record allocation stacks” checkbox at the top of the Memory panel, since tracking allocations can degrade the application’s performance while the box is checked. The payoff, however, is worth it: this view groups the things in the heap by the source location in your JavaScript code. Unlike other groupings, this view directly ties items in memory back to the code that actually created them.
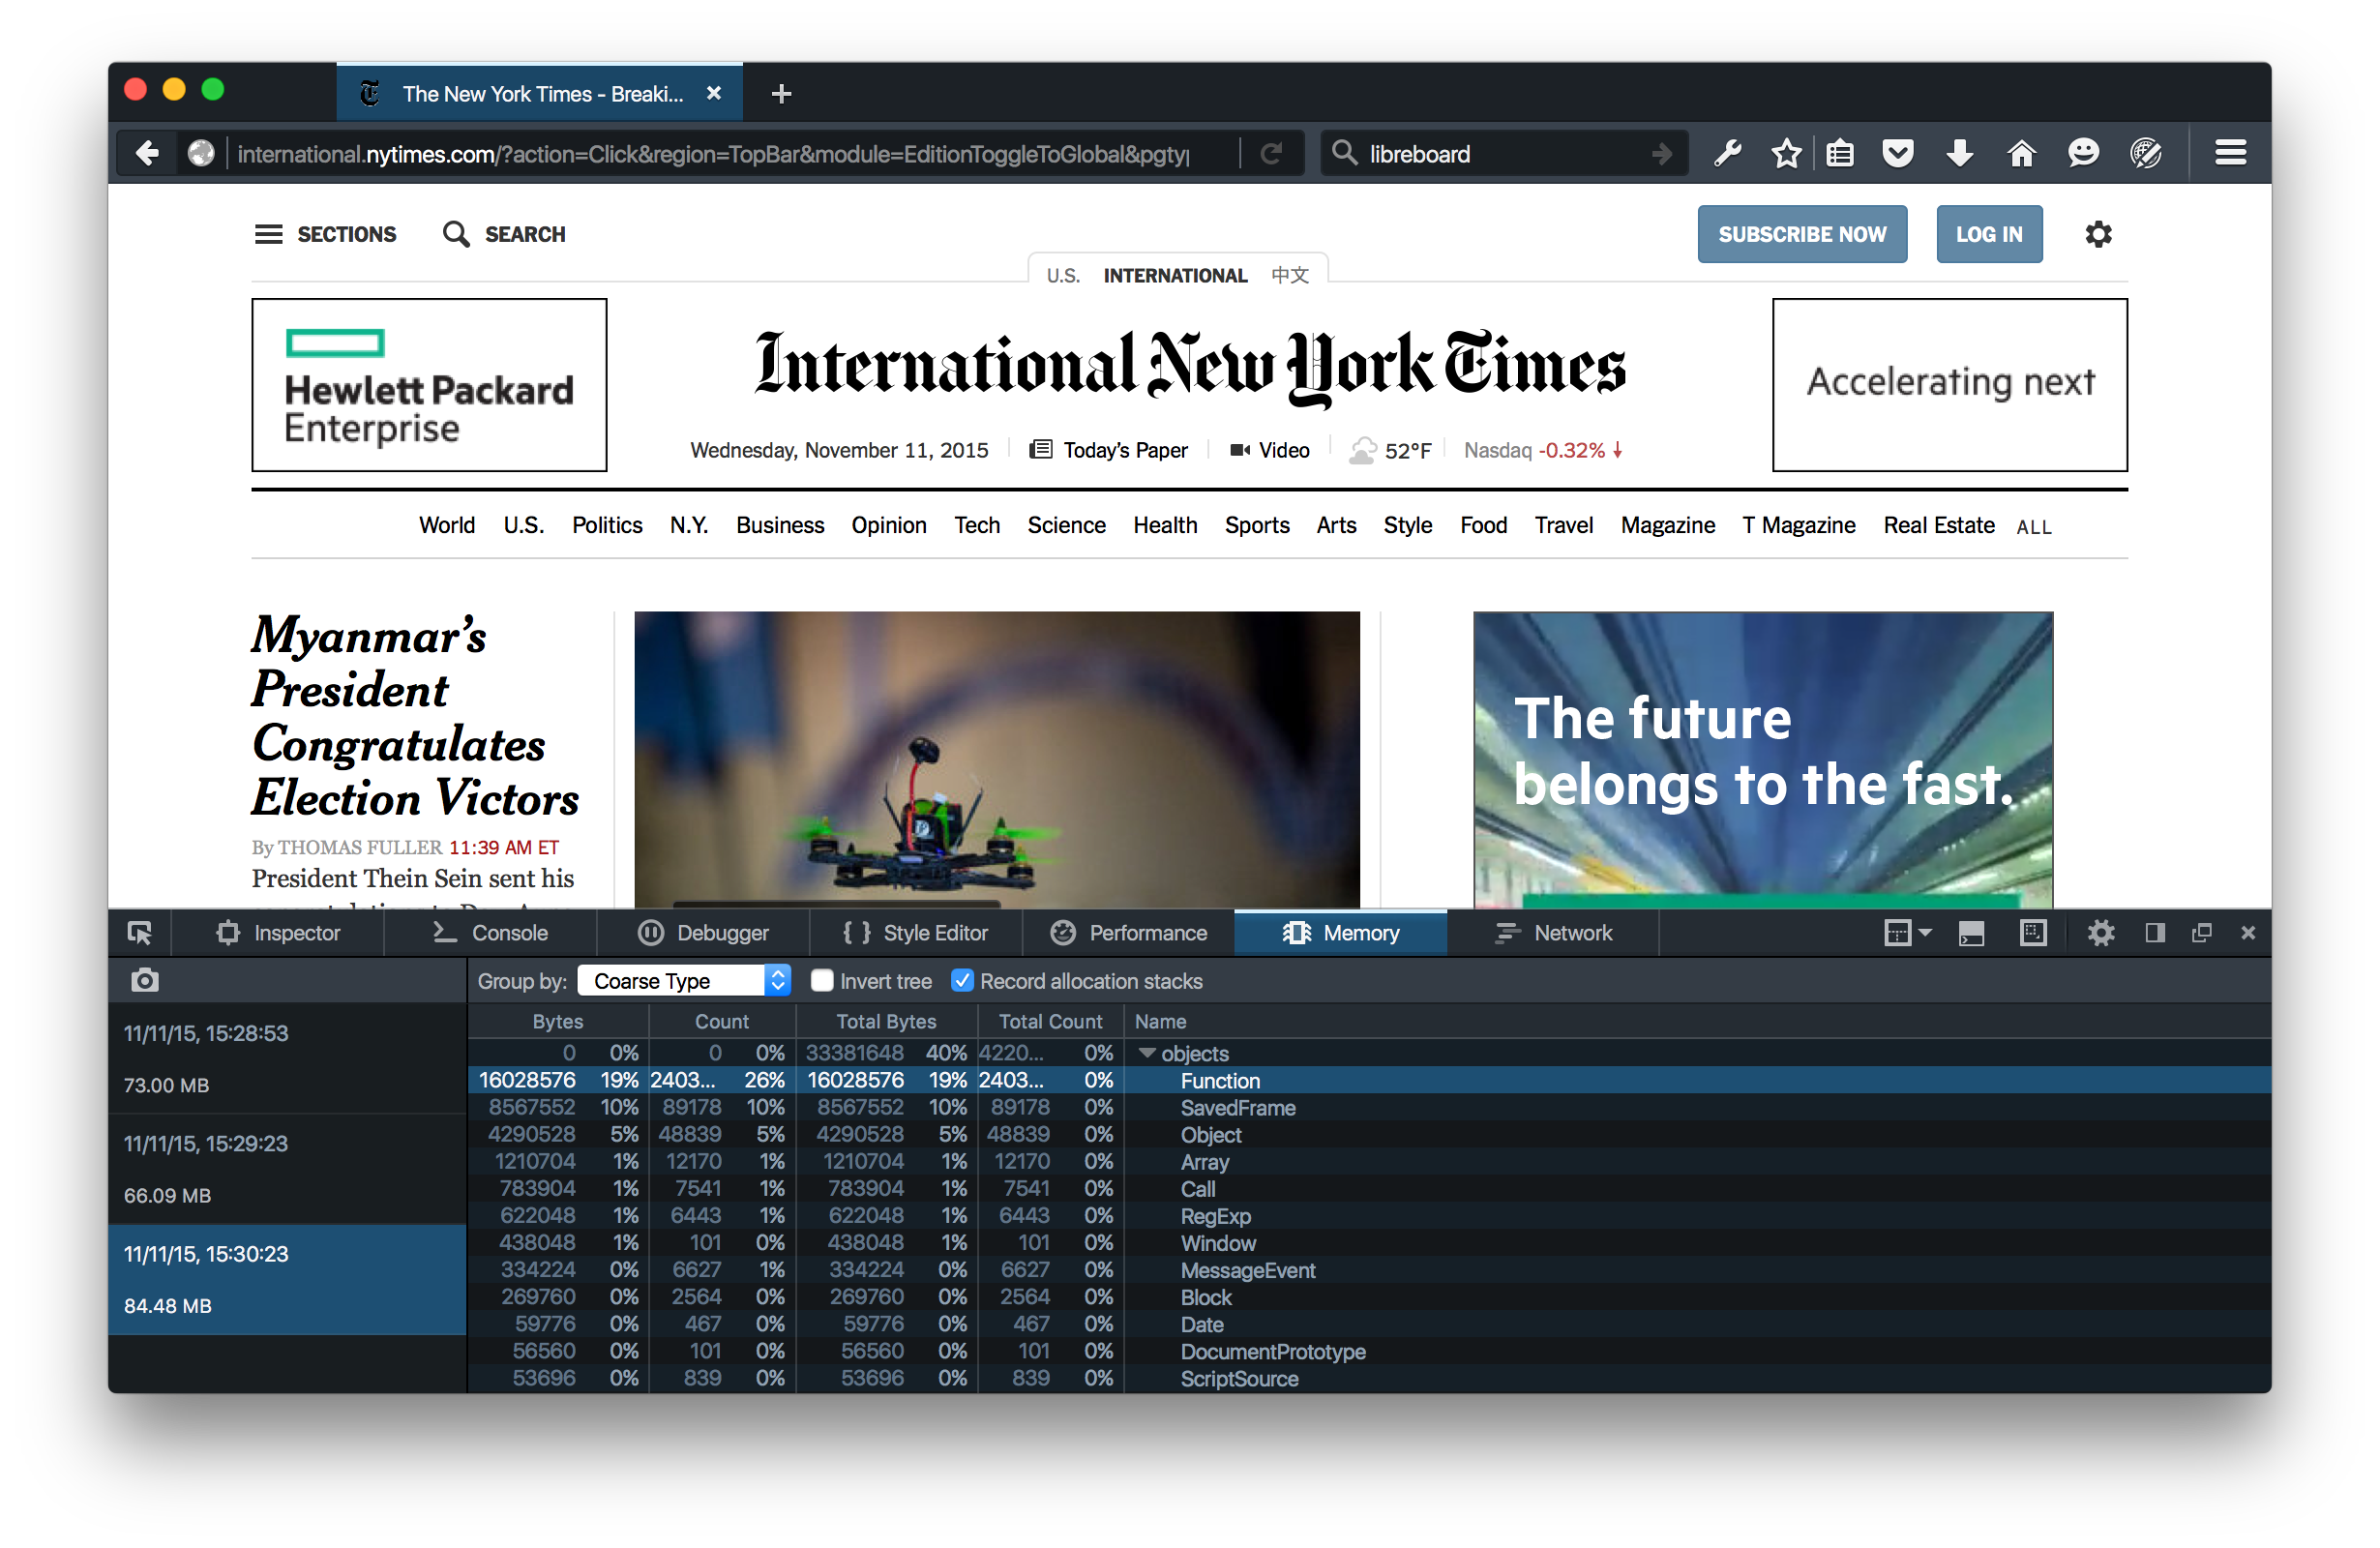
The list of snapshots also includes the total MB of memory accounted for in the snapshot. You can take several snapshots to help determine at a glance whether your application’s memory usage is growing or shrinking over time.
To learn more, check out the Memory tool documentation on MDN, and remember, we want to hear from you! Download Firefox Developer Edition today, and let us know what tools or enhancements you want to see next by leaving a comment or tweeting at @FirefoxDevTools.
About Dan Callahan
Engineer with Mozilla Developer Relations, former Mozilla Persona developer.
More articles by Dan Callahan…
About Nick Fitzgerald
I like computing, bicycles, hiphop, books, and pen plotters. My pronouns are he/him.
4 comments