The Command Line API is a collection of aliases, convenience functions, and shortcuts to interact with your web page right from within the JavaScript console. In this article, we will have a look at some of those helpers and how you can leverage them for a better developing and debugging experience.
You can access your browser’s JavaScript console in a variety of ways. Usually pressing F12 and clicking the Console tab works best.
Before we dive in, let me ask you a little quiz question: Do you know what it takes to visualize the outline of your CSS layout in the browser?
Exactly 108 bytes.
[].forEach.call($$("*"),function(a){a.style.outline="1px solid #"+(~~(Math.random()*(1<<24))).toString(16)})
A tweet-sized debugger as Addy Osmani, the creator of this smart one-liner, put it. Go ahead and try it out right now. Just copy the line and paste it into the JavaScript console of your favorite developer tools, like Chrome’s DevTools, Firefox’s Firebug, Opera’s Dragonfly, Safari’s Web Inspector, or even IE’s F12 tools (although IE only supports the $ family and the console object).
While the creation of the color hex value is impressive, I want to draw your attention to the peculiar $$. This is an alias for document.querySelectorAll and one of many clever bits in the Command Line API. Let’s see what else the API has to offer.
The Command Line API is only accessible in the JavaScript console. You cannot make the API available to your scripts on the page. On the bright side, this gives you the unique opportunity to try all the code snippets in the remainder of this article right here in the browser window. Simply open your JavaScript console and experiment.
Exploring the DOM
If you are familiar with the jQuery library you can probably guess what $ does. As an alias for document.querySelector it returns a reference to the first DOM element matching the given CSS selector.
Let’s see how we can use this in the famous Cookie Clicker game. In case you never stumbled upon this monotonous but weirdly addictive game: You basically click on a big cookie to produce more of those baked goods and buy all sorts of cookie-baking devices. These then produce even more cookies… you get the picture.
Now, wouldn’t it be great if we could give our hand and mouse a break and let the console take care of the cookie clicking? With a little bit of JavaScript and our new friend $ this can be achieved in a neat one-liner:
setInterval(function() { $("#bigCookie").click(); }, 10);
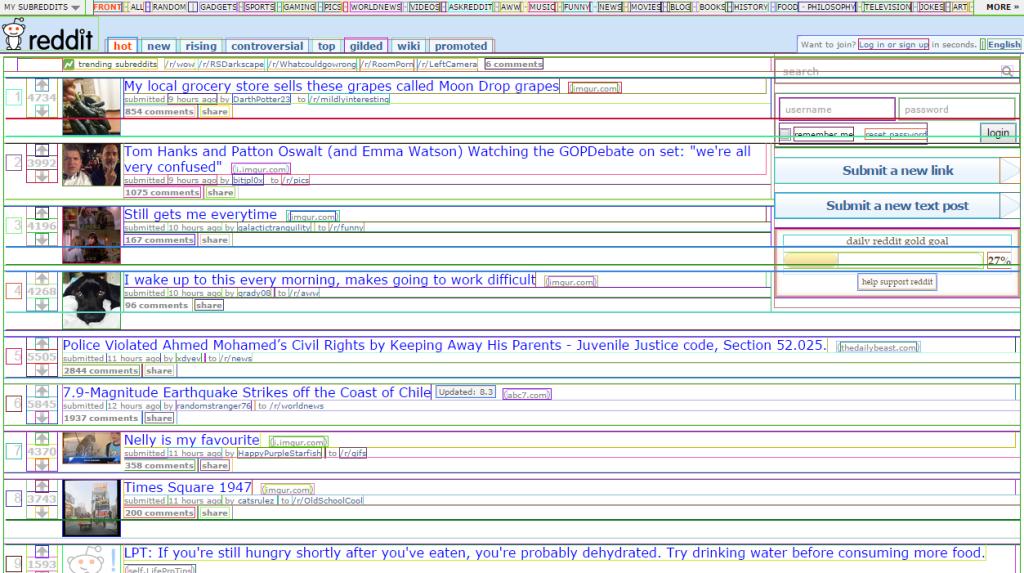
As entertaining as this is, there are also scenarios where the DOM selecting functions of the Command Line API are of actual value. You already learned about the power of $$ in the introduction of this article. As an alias for document.querySelectorAll it returns an array of all the DOM elements that match the given CSS selector.
For example, we can use this function to extract all the image sources of a web site:
var pics = $$("img");
for (pic in pics) {
  console.log(pics[pic].src);
}

If you are looking for a specific element and want to examine it closer, use inspect. inspect(document.body), for example, will bring you directly to the body element in the Elements tab of your developer tools. (inspect also works if you pass a JavaScript function to it — it will take you to the Sources panel.)
Keeping Track of Objects
When I was trying to grasp JavaScript’s prototypal inheritance, I had a little friend in the console: dir called on an object this method presents you a listing of all the object’s properties, including for example prototype and _proto_. This is only one of many scenarios where dir comes in handy. I find it relieving to have a shortcut to all my object’s properties.
If you are only interested in the direct properties of your objects (i.e. properties not inherited from the prototype chain), you can use keys and values to get an array containing the names and the associated values, respectively. Try it out:
var a = {
  "one": 1,
  "two": 2,
  "three": 3
}

> keys(a)
  ["one", "two", "three"]

> values(a)
  [1, 2, 3]
Since objects are the most basic and omnipresent data structure in JavaScript, I make quite heavy use of these functions to keep track of object state.
Debugging in the Console
Whenever something goes wrong with one of my web sites or apps, the first thing I do is check the console for error messages. I spend a lot of my developing time in the console. If you are no different, then you should be excited about functions like debug and monitor. Those are just two examples of mighty debugging tools that the Command Line API puts right at your fingertips. (Unfortunately, Safari’s Web Inspector does not support these two functions.)
debug(YourLibrary.someFunction)
This sets a breakpoint at the first line of the function YourLibrary.someFunction and every time it is called, the debugger opens. Since I practically live in the console, this is a much faster alternative to skimming through the source code and setting the breakpoint manually, especially when you are working with minified code. To turn this behavior off you can simply call undebug on the same function.
If you don’t want to invoke the debugger, but just get notified whenever a certain function is called and with what arguments, monitor is your friend.
The following code in the console:
function square(n) {
  return n*n;
}
monitor(square)
will for example notify you like this in Chrome once you call square:
> square(5);
  function square called with arguments: 5
Just call unmonitor on the same function to stop monitoring. Please note, that monitor in Firebug only works with functions inside the code of your page. Please see my Stackoverflow question for more information.
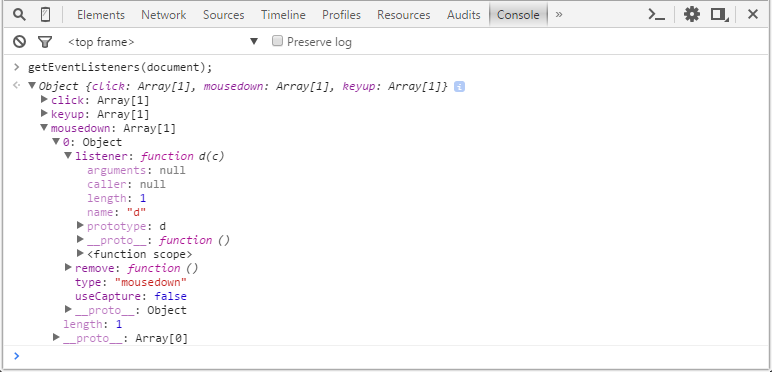
The Command Line API has also got you covered when it comes to event debugging. getEventListeners returns an object with an array for each event type (like “click” or “mousedown”) that is registered on a specified object.
getEventListeners(document);
To take this a step further, you can also use monitorEvents to get feedback in the console whether specified events are actually fired. Go ahead and type this into the console:
monitorEvents(window, "resize");
Once you resize the browser window you will get feedback in the console and the Event object for further examination. Firebug adds a nice extra and even informs you which DOM elements under- or overflow the current viewport—extremely helpful for debugging responsive layouts.
You can also specify multiple events or even choose from a list of event types:
monitorEvents(window, ["scroll", "mousedown"]);
monitorEvents(document, "key");
Please see the Command Line API reference at Google Developers for a complete list. By that time it may not come as a surprise that you can deactivate event monitoring with unmonitorEvents.
An Extra Treat for Chrome Users
Sooner or later the debugging functionality in the console will reveal some shortcomings, including:
debugandmonitordon’t work on native methodsmonitorEventsdoes not work for custom events- Missing functionality, such as breaking on object property access
Luckily, Amjad Masad has been addressing these points in his amazing Chrome extension Debug Utils (you can find the source on Github).
So How Will You Use the Command Line API Today?
The Command Line API offers a whole bunch of helpful convenience functions for an ad hoc assessment of your web pages and apps. Especially inside my debugging workflow it soon replaced the whole console.log nightmare and became one of my favorite tools.
The JavaScript console is a powerful tool that you can access right here, right now in every major browser. Are you using it? If so, what are your favorite tips and tricks?
Frequently Asked Questions (FAQs) about Command Line API
What is the Command Line API and why is it important?
The Command Line API is a set of functions that provide a way to interact with the system using text-based commands. It is important because it allows developers to perform tasks more efficiently and automate processes. With the Command Line API, you can create scripts to automate repetitive tasks, manage files and directories, and interact with web services. It is a powerful tool that can greatly enhance productivity when used effectively.
How can I start using the Command Line API?
To start using the Command Line API, you need to have a basic understanding of how the command line works. You can start by learning some basic commands and understanding how to navigate the file system. Once you are comfortable with the basics, you can start exploring the API functions and how they can be used to automate tasks and interact with web services.
What are some common uses of the Command Line API?
The Command Line API is commonly used for tasks such as file management, process management, and interacting with web services. For example, you can use it to create, move, and delete files, start and stop processes, and send requests to web services. It is also commonly used for scripting and automation, allowing you to automate repetitive tasks and streamline your workflow.
Can I use the Command Line API with any programming language?
The Command Line API is not tied to any specific programming language. It is a set of functions that can be used from the command line, regardless of the programming language you are using. However, some languages may have libraries or modules that provide a more convenient interface to the API.
What are some challenges I might face when using the Command Line API?
Some challenges you might face when using the Command Line API include understanding the syntax of the commands, dealing with errors and exceptions, and managing the security risks associated with running commands from the command line. It is important to have a good understanding of the commands you are using and to always validate and sanitize any input to prevent security vulnerabilities.
How can I secure my use of the Command Line API?
To secure your use of the Command Line API, you should always validate and sanitize any input, avoid running commands with elevated privileges unless absolutely necessary, and use secure communication protocols when interacting with web services. It is also a good idea to keep your system and any libraries or modules you are using up to date to ensure you have the latest security patches.
Can I use the Command Line API to interact with web services?
Yes, you can use the Command Line API to send requests to web services and process the responses. This can be a powerful way to automate tasks and integrate different services. However, you should be aware of the security implications and ensure you are using secure communication protocols and validating and sanitizing any input.
How can I debug issues with the Command Line API?
Debugging issues with the Command Line API can be challenging due to the lack of a graphical interface. However, most command line environments provide tools and features that can help with debugging, such as logging and error reporting. It is also a good idea to test your commands and scripts in a controlled environment before using them in production.
Can I automate tasks with the Command Line API?
Yes, one of the main uses of the Command Line API is to automate tasks. You can create scripts that use the API functions to perform tasks automatically, saving you time and effort. This can be particularly useful for repetitive tasks or tasks that need to be performed at regular intervals.
Where can I learn more about the Command Line API?
There are many resources available online to learn more about the Command Line API. You can find tutorials, guides, and documentation on various websites and blogs. It is also a good idea to experiment with the API and try out different commands and functions to get a feel for how it works.
 Stephan Max
Stephan is a Dublin-based developer originally from Germany. Holding a degree in computer science and being a code wrangler at heart, he works as a technical cloud adviser inside the IBM Bluemix team by day and moonlights as a front-end developer and JavaScript engineer. He loves traveling, writing, music, and building stuff that helps people.