
We're excited to introduce JavaScript telemetry, which provides a timeline of events in the browser leading up to when an error occurred. This helps you find the root cause of JavaScript errors faster by providing critical information on user behavior, network activity, and more. You might also think of this timeline of events as a trail of breadcrumbs or a black box recorder which tells you what happened just before a crash or error.
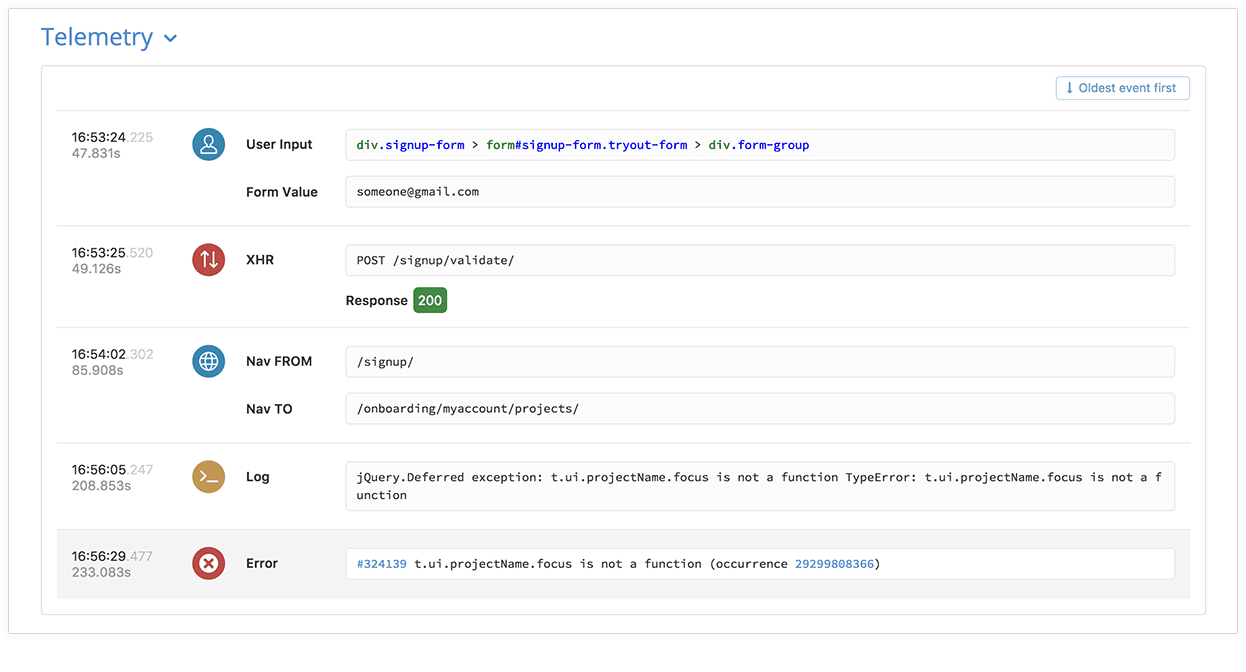
In the screenshot below, we see a timeline showing a complete story of how the user encountered an error. First they loaded the page, typed their email address into the sign up form, validated the email, navigated to an onboarding page, and then the error occurred. This gives clear context on what caused the error and which component needs to be fixed.
{: .imgcaption}
JavaScript telemetry data, as seen in Rollbar
Troubleshooting can be difficult and time-consuming
If you’re a web developer, you know it can be difficult to reproduce unusual errors and problems reported by users. There are many variables including inconsistent browser environments, unexpected user behaviors, network calls, state changes in the application, and more. Reproducing problems costs your team time in development, QA and support. Unfortunately, if your team cannot reproduce the problem it’s often put on the back burner which can leave users hanging with no resolution.
Having enough contextual information can save you time because you can quickly see the cause of the problem without having to manually test different scenarios or debug your code. It also improves time to resolution because you don’t have to ask for the user for clarification about what they were doing, the complete context will be tracked automatically and available instantly.
How telemetry helps you fix impactful issues, faster
Rollbar helps you fix impactful issues faster by giving you additional context, including the following data:
| Item | Description |
|---|---|
| Page load events | Tells you when the DOM content loaded and the full page loaded, to help distinguish errors before and after page load |
| User behavior | What users clicked on, typed into input boxes, or navigated routes in single page apps |
| Console messages | Log events and error messages that occurred just before the error |
| Network activity | XHR and fetch calls to APIs on own server or a third party’s |
| Rollbar exceptions and messages | If other exceptions or messages occurred leading up to this one, we'll include links to them in the telemetry timeline |
An example of how to use custom Rollbar messages is to you can track is the full response data from API calls. This is particularly useful for seeing the status code from the server, which could indicate a problem processing the request due to rate limiting, authentication problems, and more.
Additionally, if you track a unique identifier such as a transaction ID you will be able to trace the error to a specific request on the server side. This provides you additional information to debug server-side problems with database connections, business logic, etc.
Unlike with logs, you don’t have to worry about having too much debug information tracked through breadcrumbs because the information is only sent in the case of an error. Providing enough debug information may help you fix edge cases even if you can’t easily reproduce it in your own browser.
Getting started with JavaScript telemetry
The first step to getting telemetry data is to make sure you’re using the latest version of the JavaScript SDK, rollbar.js{:target="_blank"}. Version 2.2.0{:target="_blank"} or higher sends telemetry data back to Rollbar. It’s backwards compatible so you should be able to just drop the new version in. At this time, we only support telemetry data for client-side JavaScript so you only need to update your client-side code. If you’re using our client-side snippet or CDN library, it should update automatically. If you’re using bower or npm you will need to run the update command and then deploy the new version.
npm update --save rollbar
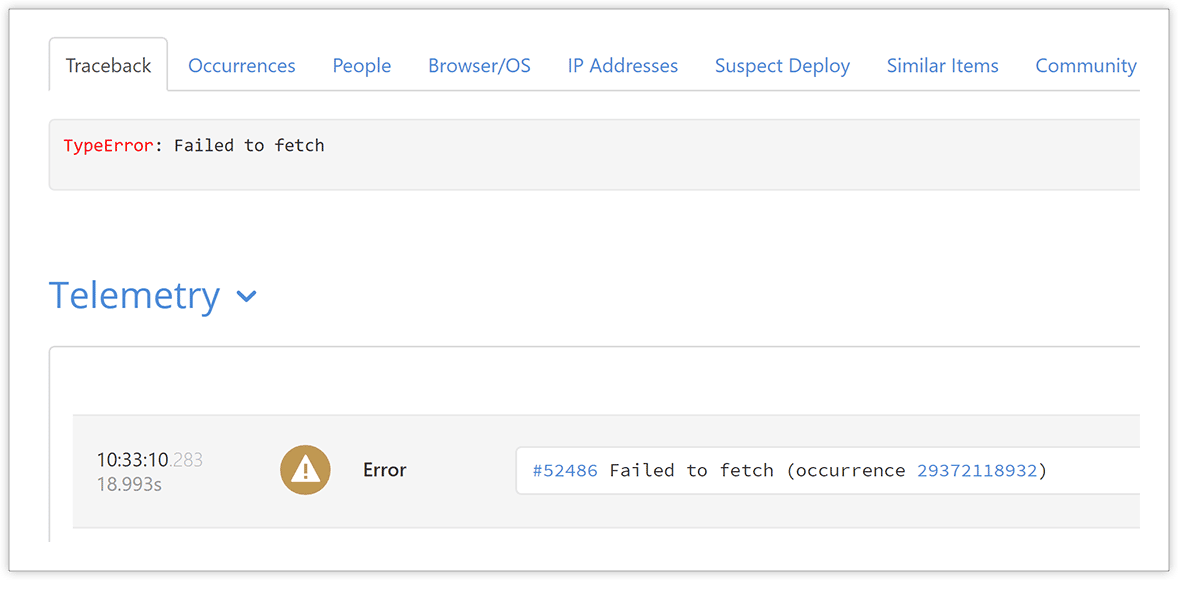
You can see the telemetry data in the Rollbar application on the error item view. The first tab is the Traceback tab, and the telemetry data will be shown at the bottom when data is available for the error item. You will be able to see more by clicking on the Occurrences tab. Seeing commonalities between multiple occurrences can help you identify what common conditions could be associated with the root cause.
{: .imgcaption}
JavaScript Telemetry, available within the Traceback tab, in Rollbar
To learn more about it please see the telemetry documentation. We also provide options to fine tune which types of telemetry data are sent in the rollbar.js documentation.
If you haven’t already, signup for a 14-day free trial of Rollbar and let us help you take control of impactful JavaScript errors. 🙂