
In this article, we’ll cover Firefox Web Developer Tools (“DevTools”) — a set of tools designed to help developers inspect, debug, profile and optimize the performance of websites and web applications. We’ll particularly look at the tools related to performance, but we’ll also see how to get started using DevTools in general, and learn about some useful settings.
You can access DevTools in different ways:
- click on the hamburger menu at the right of the navigation toolbar, click on Web Developer, then choose the sub-tool you want to use
- use keyboard combinations, such as Shift+F5 (Windows and macOS) for the Performance tool and Ctrl+Shift+E (Windows) or Cmd+Option+E (macOS) for the Network tool
- right-click anywhere in the page a choose Inspect Element.
DevTools Settings
The Firefox DevTools have many options that help developers customize their experience, such as the option to Enable time-stamps in the Web Console, or to Disable HTTP Cache, which is used to simulate first-load performance in all pages that have DevTools open.
You can access the DevTools Settings panel in different ways:
Start by opening DevTools, next:
- either click the Settings button in the toolbar
- press
F1to show the Settings panel on top of any current tool - press Ctrl+Shift+O (Windows and Linux), Cmd+Shift+O (macOS) to show the Settings panel.
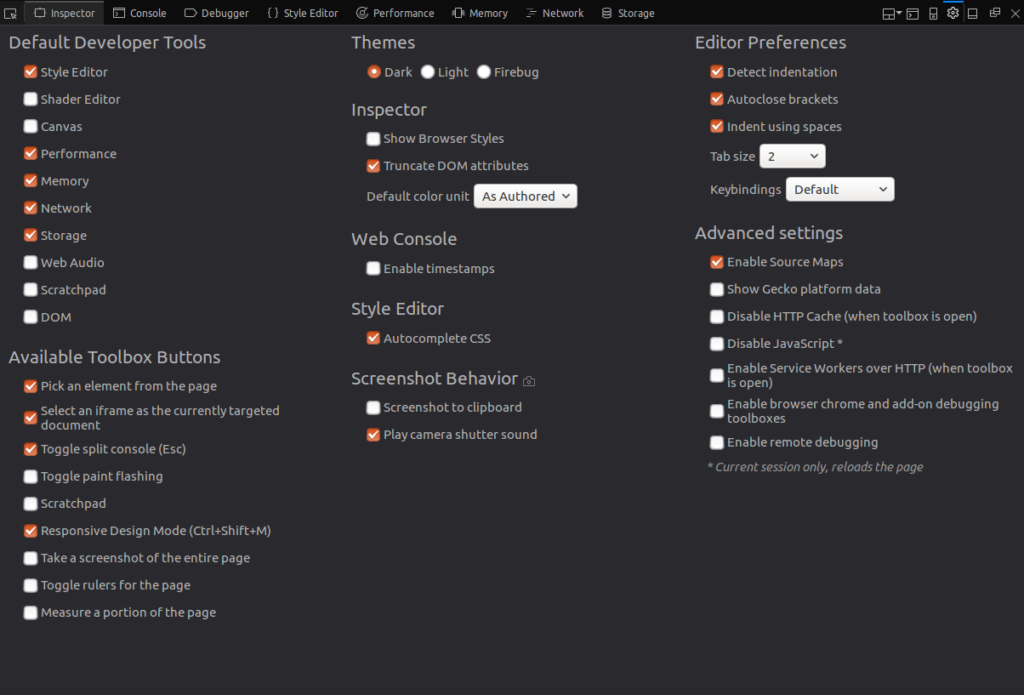
Here you can choose your default tools, the buttons you want to show in the toolbox, themes (dark-light-Firebug) and other advanced settings.
Performance-focused Tools
When analyzing the performance of a web application, you need to differentiate between load-time performance and run-time performance.
Load-time performance answers questions like “what resources are taking too much time to load?” When dealing with run-time performance, we need to focus on JavaScript and CSS (CSS animations in particular) so we’re able to see where the code spends most of its time and what’s causing bottlenecks.
Let’s look at the Network Monitor and the Performance Tool.
The Network Monitor
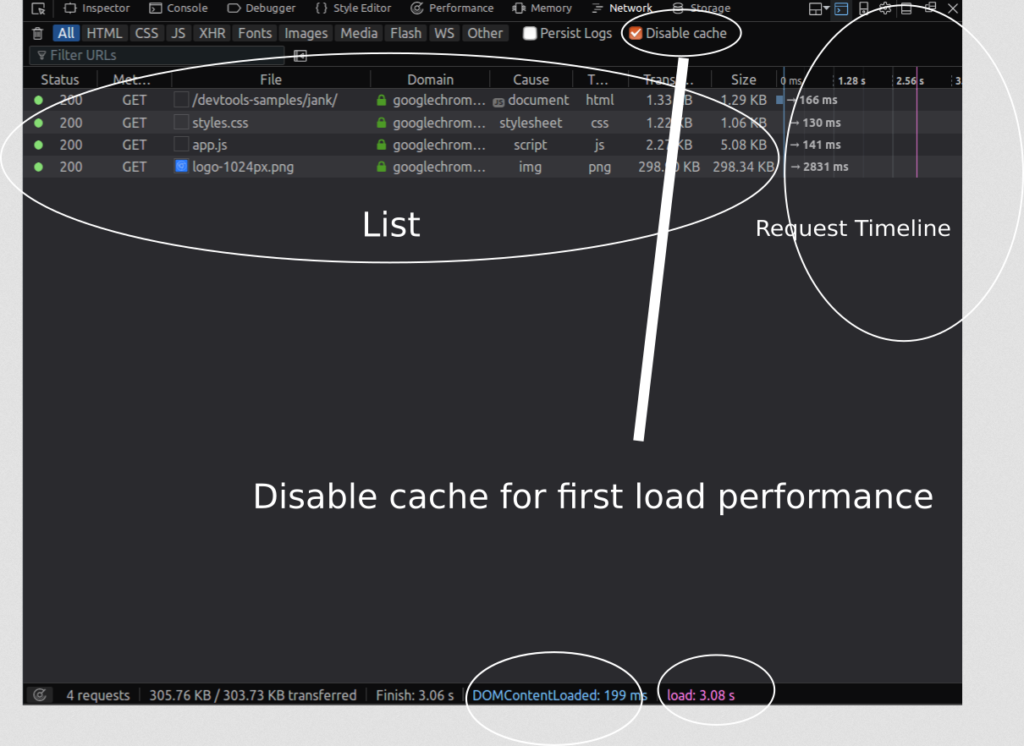
The Network Monitor shows you a tabular view of all network requests that Firefox made (for example, when it’s loading a page, or sending XMLHttpRequests, Fetch API requests etc.).
It can also display request-related HTTP headers, HTTP responses and cookies, and let you search through them. You can also use it to perform, display and save a performance analysis of the current page load.
In a nutshell, this tool can be used to determine how long the browser takes to download different assets of a web page.
You can also use this tool to monitor and single out requests that are slowing or blocking the web page’s fast loading. The Network panel shows you when principal events are fired (DOMContentLoaded and load).
Request Timeline
Each request in the network list has a timeline column which displays timing information related to the request, such as the total time taken to load the resource.
DevTools marks major life-cycle events in the report, like DOMContentLoaded, and page load. The blue refers to the time when the event DOMContentLoaded is fired; the purple line refers to the time when the page’s load event is fired.
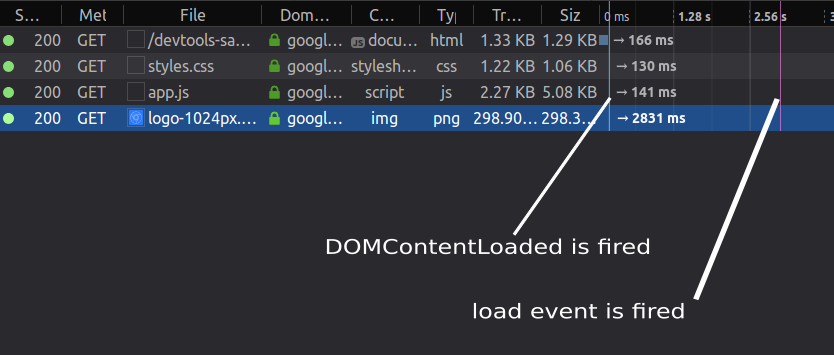
DOMContentLoaded vs Load Events
The DOMContentLoaded event fires right when the HTML document is completely loaded and parsed, not including CSS style sheets, images, and frames.
The event load fires when the HTML document and all associated style sheets, images and frames are completely loaded.
Request Details Panel
Once you click on a request in the requests list, you can a see right-docked details pane which has many different tabs such as headers, params, response, timings and security.
For performance, we’ll particularly look at the timing information.
Network Timings
In this pane, there are many timing metrics related to each request:
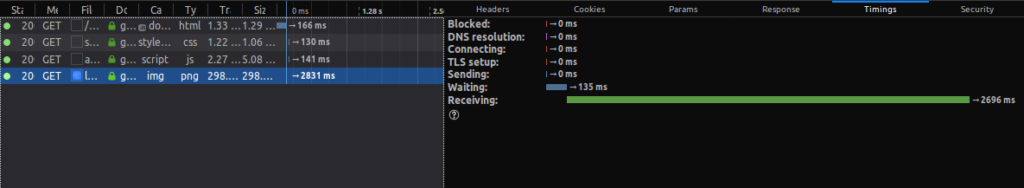
Blocked is the time spent in a queue waiting for a network connection.
Sending is the time taken for sending the request to the server.
Receiving is the time taken to receive the response from the server or (if it’s cached) to read it from the cache.
Waiting is the total time waited by the client before the first byte has been received. In other performance analysis tools like WebPageTest.org or Chrome’s DevTools, this is called TTFB or Time to First Byte.
There’s also DNS resolution, which is the time taken to resolve the host name of the server, and Connecting, which is the time taken to open a TCP connection.
How to analyze the load time performance
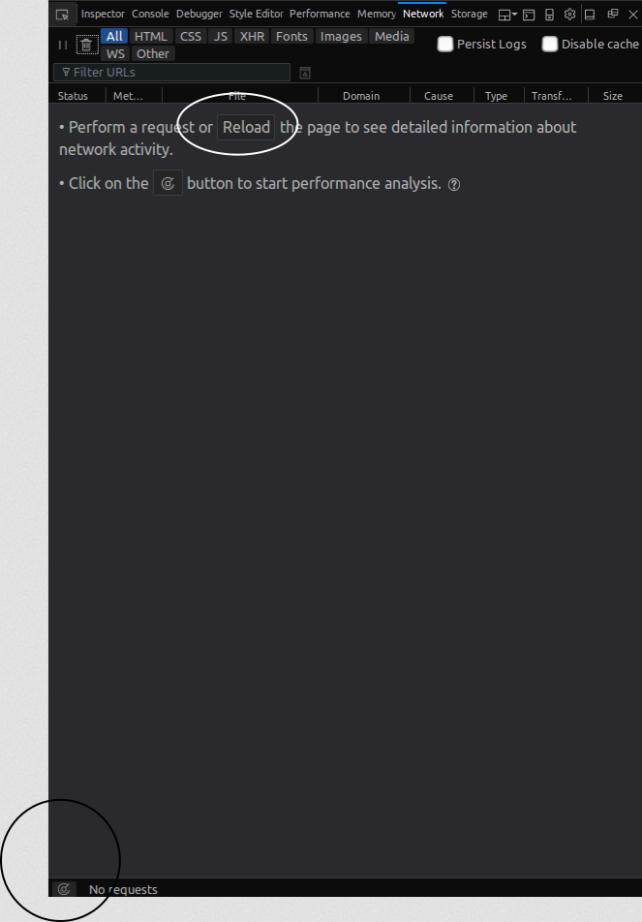
The Network Monitor integrates a performance analysis tool that can be used to analyze the load-time performance of your web page.
To start analyzing the load-time performance, you can:
- click the Analyze icon in the bottom status bar
- reload your page or make a network request while your Network monitor is open (actually this is going only to show tabular information about requests not do a load-time performance analysis).
The final report shows a pie chart and a corresponding table for the received resources by types: JavaScript, CSS, images and fonts etc. and a summary with the following details:
- number of cached responses
- total requests
- size
- transferred size
- loading time
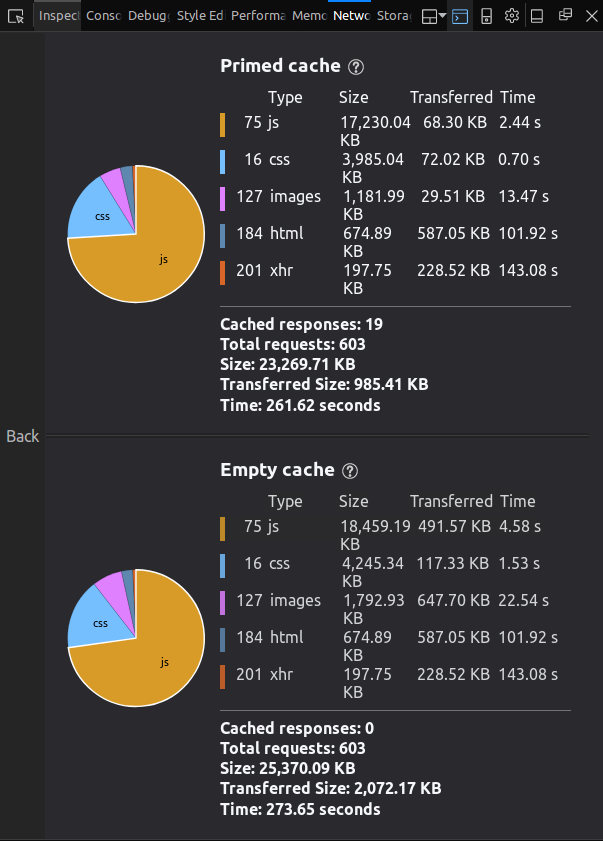
The web page is tested with an empty cache, and with a primed cache.
First load performance
Firefox’s DevTools allow you to analyze the performance of your web application in two different situations:
- Without caching, which emulates the first-time visit when assets are still not cached.
- With caching, which emulates the second-time visits. The browser has already cached the app’s assets, eliminating many round-trips to the server.
You can also use the Disable Cache setting to emulate the first-time load of a web page when the DevTools are open on any tab.
JavaScript Performance and Responsiveness
JavaScript is single-threaded, which means the browser runs code synchronously, but thanks to HTML5 Web Workers (a standard API for multi-threading JavaScript) you can also run code in other threads.
This single thread is responsible for running all the work the browser is doing such as layout rendering, calculating styles and collecting garbage.
Also methods such setTimeout, events such click and load and resource fetching, all get executed by the single thread. (It’s true that these tasks are executed asynchronously, but the a-synchronicity in JavaScript is different: it’s emulated by using an event-driven approach, with an events loop and queue.)
Good performance and responsiveness are due to JavaScript’s asynchronous model, but long-running functions can lead to bad performance and poor UI responsiveness.
The Performance tool
The Performance tool allows you to discover bottlenecks and performance issues of your web pages by giving you insights into your web page’s UI responsiveness (in response to user interactions) and your JavaScript code performance.
With the Performance tool, you can start a performance analysis of your currently opened web page over a period of time that you can control with start and stop recording buttons. The tool then shows you a summary, and tabular and graph views of the operations the browser was doing to render your page.
You can look for and detect long-running pieces of code that block the single thread using the Performance tool.
How to use the Performance tool
The steps to use the performance tool are quite easy:
- open your web page, open the Performance panel, then start recording the performance
- wait a few seconds, also make sure to interact with your page during the profiling, then stop the recording
- look for any long-running functions or events, and focus (zoom in) on the time portions where FPS is low.
- when you find any activities that can be targeted for further optimization, you can use other sub-tools to get detailed information about where to take action.
Make sure to follow some user interaction scenarios and interact with the different parts of your app’s UI during the profiling process, particularly the parts you want to optimize. Also avoid unnecessary extra actions: for example, don’t interact with the parts you’re not trying to analyze, since they’ll just add more noise to your report’s results.
Selecting the Time Range
Firefox’s DevTools support selecting or narrowing the time range over the profile’s time. You can click on the timeline or the FPS chart section, then drag your mouse to select a span of time. Once you stop dragging, DevTools updates the other views and charts to only display information about events that happened during that time span.
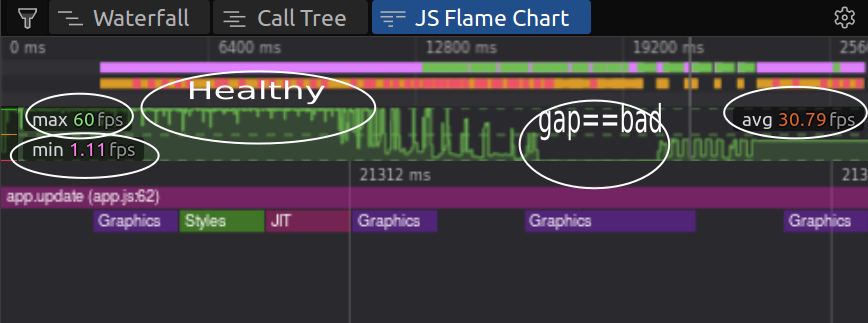
The FPS chart
The frame-rate chart displays the frames per second over the period of the recording. When the recording is running, this chart acts like an FPS meter with live values.
The FPS chart shows the max, min values of FPS and the average FPS value over the time of profiling. All these values can quickly tell you if you have any performance bottlenecks.
If you’re running any animations, the FPS should be 60 fps. Watch this video to understand why this value is important:
You can use this chart to quickly spot visual gaps (collapses) and inconsistencies that denote severe drops of the frame rate (meaning the browser is having performance bottlenecks).
You can see from this screenshot an FPS chart with collapses:
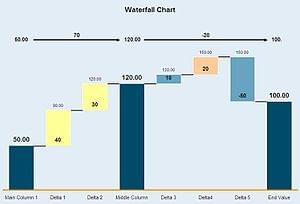
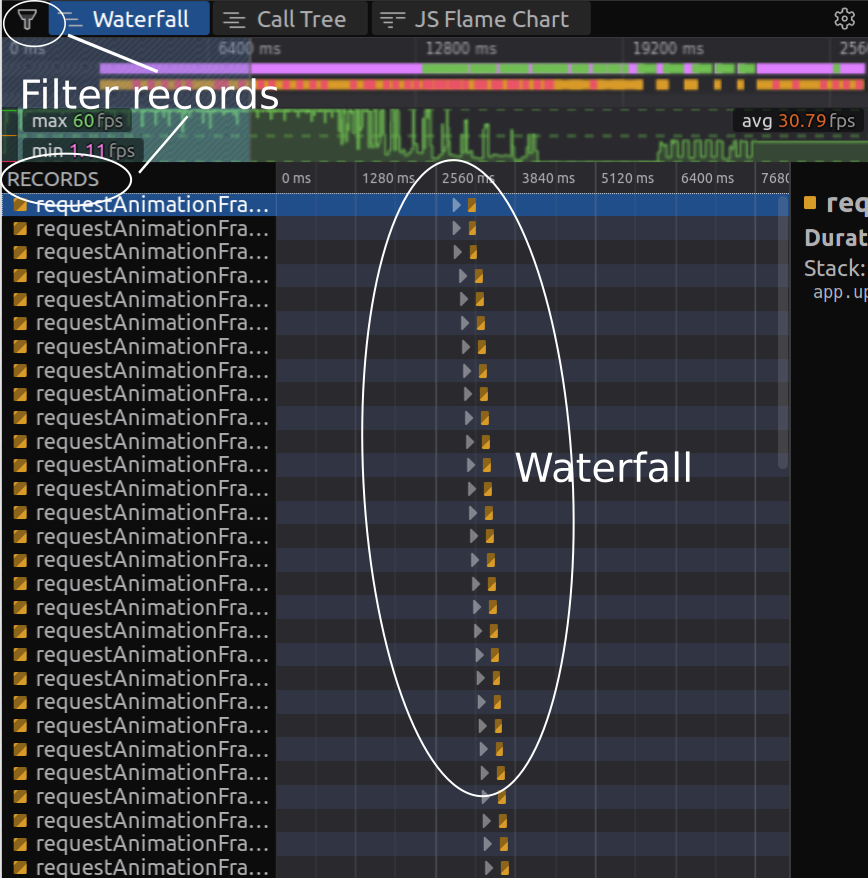
The Waterfall chart
Wikipedia explains a waterfall chart as:
a form of data visualization that helps in understanding the cumulative effect of sequentially introduced positive or negative values. The waterfall chart is also known as a flying bricks chart or Mario chart due to the apparent suspension of columns (bricks) in mid-air.
In the case of the Performance tool, the Waterfall chart displays a breakdown of the activities and browser-specific events the browser was performing, such as:
- layout rendering or laying out elements (called also reflows)
- styling
- animation frames requests
- repaints or pixels drawing
- garbage collecting etc.
Layout operations or reflows and style calculations are expensive, so these can be potential areas for optimization. See this Google article for more details.
Here’s a screenshot of the waterfall chart of an example application:
The Call Tree view
The Call Tree view displays the JavaScript functions on which the browser spent most of its time, with important measures such as the activity’s total time, self time and their percentages relative to the total profiling time.
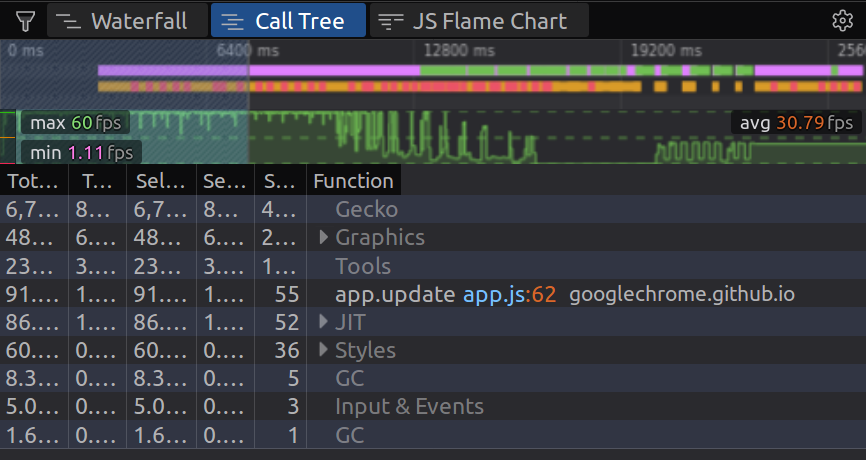
Self time refers to the time taken solely by the operation without considering the functions it calls.
Total time refers to the time taken by the operation and the functions it calls.
The Call Tree tells you, statistically, in which functions (aggregated) your browser is spending most of the time across a recording.
The JS Flame Chart
The Flame Chart displays a Flame graph of JavaScript call stacks during the profiling period. Flame charts are a type of performance visualization created by Brendan Gregg.
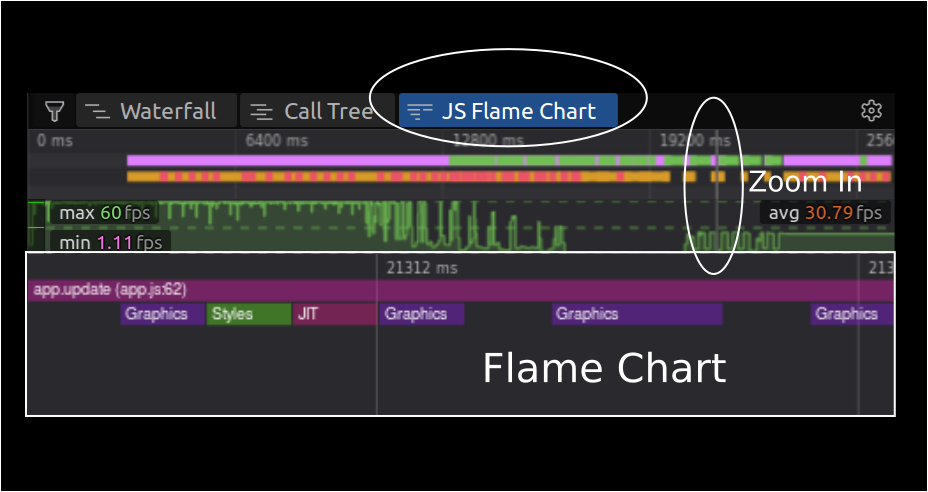
A Flame Chart enables most of the hot code-paths to be identified quickly and accurately.
Stacked bars mean that the top operation, which exists directly in the CPU, invoked the bottom operation.
You can read more about Flame charts here.
You can use the Frame rate and JavaScript Flame charts, the Waterfall and the Call Tree views to figure out where you have performance problems, and to single out the particular functions that need optimization.
The Flame Chart shows you the state of the call stack of particular functions at particular times of the recording.
The Flame Chart has tons of data, so to get meaningful readings you need to zoom in until you select a few milliseconds.
Color Codes
The different charts and sections are color coded using the same colors for the same types of operations and assets — JavaScript, CSS, rendering, painting etc.
You can use colors to distinguish between operations in different views, quickly spot the type of the operation causing issues, and to keep up with the operations’s types when switching between different perspectives.
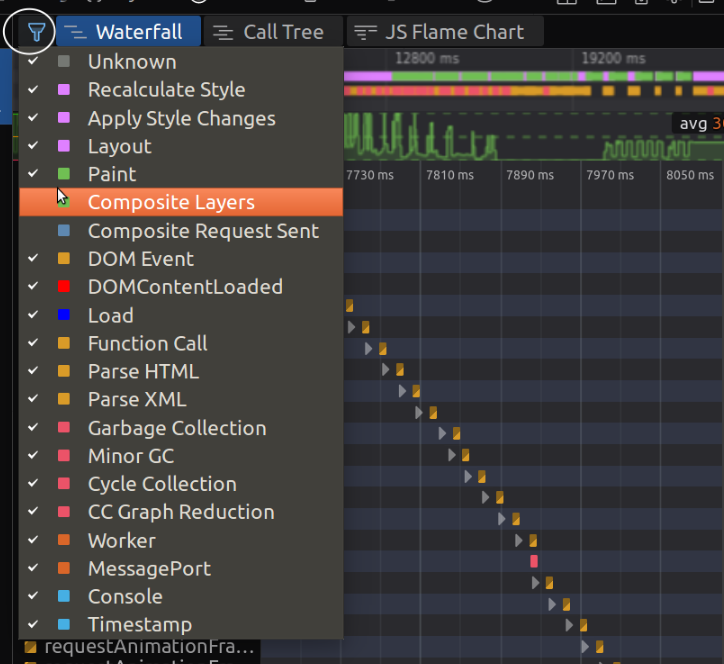
You can filter out the single activities that you want to see in your charts and views via this menu, where you can also see the different colors associated with the different operations.
For example, if you’re working with CSS animations, what you need to focus on are activities such as Recalculate Style, Apply Style Changes, Layout and Paint. You can filter out the other activities for less noise.
For JavaScript, you need to focus on Function Call, Parse HTML and Parse XML.
Conclusion
In this article, we’ve seen how to get started with Firefox’s DevTools and how to use different performance-related sub-tools. Firefox’s DevTools are incredibly comprehensive, and with Firefox’s recent performance upgrade, it’s all the more able to accurately identify truly problematic areas of a website’s rendering processes. We encourage you to explore further on your own, now that you’re familiar with the terminology and know what to look for.
Frequently Asked Questions (FAQs) on Performance Auditing with Firefox Developer Tools
What is the purpose of performance auditing in Firefox Developer Tools?
Performance auditing in Firefox Developer Tools is designed to help developers understand how their web applications are performing in real-time. It provides insights into various performance metrics such as load time, rendering speed, and JavaScript execution. By analyzing these metrics, developers can identify bottlenecks, optimize their code, and improve the overall user experience.
How can I access the performance tools in Firefox Developer Edition?
To access the performance tools in Firefox Developer Edition, you need to open the developer tools panel. You can do this by right-clicking anywhere on a webpage and selecting ‘Inspect Element’. Then, click on the ‘Performance’ tab. Here, you can start a new recording to analyze the performance of your web application.
What is the difference between the Firefox Developer Edition and the regular Firefox browser?
Firefox Developer Edition is a version of Firefox specifically designed for web developers. It includes a range of tools and features that are not available in the regular Firefox browser, such as advanced performance auditing tools, a CSS grid, and a JavaScript debugger. These tools can help developers build, test, and debug their web applications more effectively.
How can I use the PageSpeed Insights add-on for Firefox?
The PageSpeed Insights add-on for Firefox provides a simple way to analyze the performance of your web pages. After installing the add-on, you can access it from the Firefox toolbar. Simply enter the URL of the webpage you want to analyze, and the add-on will provide a detailed report on its performance, including suggestions for improvement.
What is the Archi FPS Meter add-on for Firefox?
The Archi FPS Meter add-on for Firefox is a tool that allows you to measure the frame rate of your web applications. This can be useful for identifying performance issues, particularly in web-based games or animations. The add-on displays the current frame rate in the Firefox toolbar, allowing you to monitor performance in real-time.
How can I use the All-in-One PageSpeed Test add-on for Firefox?
The All-in-One PageSpeed Test add-on for Firefox provides a comprehensive analysis of your web page’s performance. After installing the add-on, you can access it from the Firefox toolbar. Enter the URL of the webpage you want to analyze, and the add-on will provide a detailed report, including load time, PageSpeed score, and suggestions for improvement.
How can I improve the performance of my web application using Firefox Developer Tools?
Firefox Developer Tools provides several ways to improve the performance of your web application. You can use the Performance tab to identify bottlenecks in your code, the Network tab to analyze load times, and the JavaScript debugger to optimize your scripts. Additionally, the PageSpeed Insights add-on can provide specific suggestions for improvement.
Can I use Firefox Developer Tools to analyze the performance of mobile web applications?
Yes, Firefox Developer Tools includes a responsive design mode that allows you to simulate different screen sizes and resolutions. This can be useful for analyzing the performance of mobile web applications and ensuring that they provide a good user experience on all devices.
What are some common performance issues that can be identified with Firefox Developer Tools?
Common performance issues that can be identified with Firefox Developer Tools include slow load times, inefficient rendering, and excessive JavaScript execution. These issues can lead to a poor user experience, so it’s important to identify and address them as early as possible in the development process.
How can I learn more about performance auditing with Firefox Developer Tools?
There are many resources available to help you learn more about performance auditing with Firefox Developer Tools. The Mozilla Developer Network provides comprehensive documentation on all aspects of the tools, including detailed guides and tutorials. Additionally, there are many online communities and forums where you can ask questions and share your experiences with other developers.
 Ahmed Bouchefra
Ahmed is a technical author and web developer living in Morocco with a Master's degree in software development. He authors technical content about JavaScript, Angular and Ionic. He is also a fan of entrepreneurship, poetry, and teaching. You can contact me on my personal website and read my other articles on Techiediaries.