A little more than a year ago we realized that HubSpot’s application performance was impeding our users’ ability to complete basic tasks. As a SaaS product that thousands of business across the globe rely on every day, this was unacceptable. For our CRM product, our core product offering which sees more than 50 million page views a week, a single page load could take upward of 6 seconds for our average user—in aggregate, our users were waiting more than 9 years for that single app to load every week. Since then, our efforts to improve performance have grown from just a few of us playing with code splitting and webpack settings in our free time to two dedicated frontend performance teams and organization-wide standards for creating performant applications.
More than a year ago a few colleagues and I began this push for performance and I’m now a member of our CRM Frontend Performance team. Here I’ll cover some of the decisions we’ve made and tools we use on a daily basis to help accomplish the mission of making the HubSpot product as fast as possible. This is not a technical post on how to improve performance, but rather a guide to the decisions made and tools utilized to empower the technical work.
Conscious Investment
Like many engineering challenges, performance is a goal that is all but impossible to meet without dedicated resources. This is a lesson we unfortunately learned from experience. While a few of us spent several months attempting to improve the speed of the applications we owned and evangelize the importance of performance work to the rest of the organization, we were making slow, if any, progress over the first few months. After more investigation, we discovered this was a resourcing problem. Engineers were interested in performance - they were showing up in droves to technical presentations, asking good questions about performance, and engaging in team-wide discussions daily—but simply didn’t have the hours to devote to extensive application profiling. There were more urgent tasks at hand.
Our solution was two-fold. First, we established a platform performance team. This team is responsible for building performance as a top-level citizen into our frontend stack, including everything from more robust synthetic testing solutions to empowering long-lived cross-application static asset caches. Once our platform team had their legs under them, we established a mirroring team on the application side in our CRM—the largest application in HubSpot. By giving full-time dedicated resources to one of the highest-visibility projects at HubSpot, we were able to create a sense of urgency across the organization. With these resources in place and a growing contingent of performance-focused engineers, it was time to get to work.
Tracking the Right Thing
Before we could start to think about our performance goals we needed to track our performance consistently. Out of the box solutions for monitoring proved to be unhelpful for modern applications, as they don’t understand the intricacies of single-page app frameworks like React. Instead of using browser events like DOMContentLoaded, which don’t know anything about the content in your application or your user's intent, HubSpot has created our own internal metric tracking system that marks pages as successful or failed based on the actual components on the page.
The exact implementation has evolved over the years, from our original solution based on CSS selectors to our latest solution which tracks the rendering of “markers” based on React Context, but the core philosophy that page loads are based on the actual content of your app is unchanged. An application team chooses what “success” means based on their own business concerns, but each team places these markers with the same guideline that a page is only successful once a user has all of the information they need to do their job.
Monitoring
We’ve stood by a core principle in our journey to make HubSpot fast for all of our users: you can’t make fast what you don’t know is slow. While it’s easy to anecdotally say “this app feels slow” or “this interaction has some lag to it,” you have no way to know you’re making progress if you don’t have numbers to attribute to your changes. Similarly, you might not even know what to change without tracking some metrics and profiling your application. Your teams may find value in all or only a subset of the methods below, but it’s important to try all of them to understand what works for you. Each of these types of tracking will answer different questions about your application, and will be applicable at different stages in your journey to make an application performant.
Synthetic Monitoring
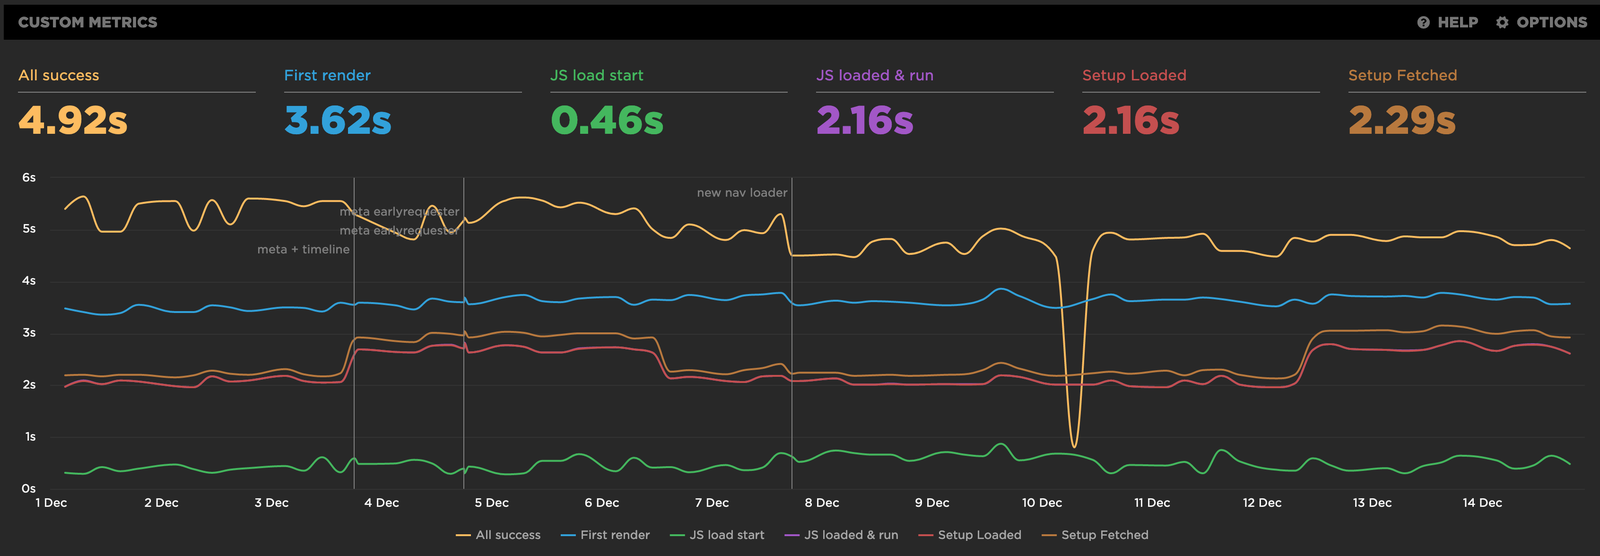
While we’ve found limited value in synthetic monitoring of our application for tracking day-over-day performance regressions, it’s been incredibly helpful for telling us how our performance is trending over time. By running performance tests on the same hardware, network connection, and user account every single test run, we’re able to isolate environment changes that might cause shifts in real user data. These tests run with a cold cache on a regular interval to give us an easy way to track our page load performance over time.
A screenshot from SpeedCurve, HubSpot’s current synthetic monitoring solution
--
As you can see, a synthetic testing environment, which is essentially just a nice UI around WebPageTest, lets us track performance over time using custom metrics that understand our app architecture. Any quality synthetic solution will even allow you to dig into the actual WebPageTest output so you can dig deeper into network calls, CPU performance, and more. You’ll also notice deploy markers on the chart, letting us pinpoint specific times in history when we made notable changes, to help correlate code changes to performance changes.
Real User Monitoring (RUM)
Synthetic testing is a great way to track isolated performance, but it doesn’t accurately simulate the hardware, software, or network conditions utilized by our users. RUM allows us to track how real users perceive our app, and the high sample size of real user data compared to a single synthetic run means a single user’s temporary network or device problems are smoothed out by the rest of our users’ data.
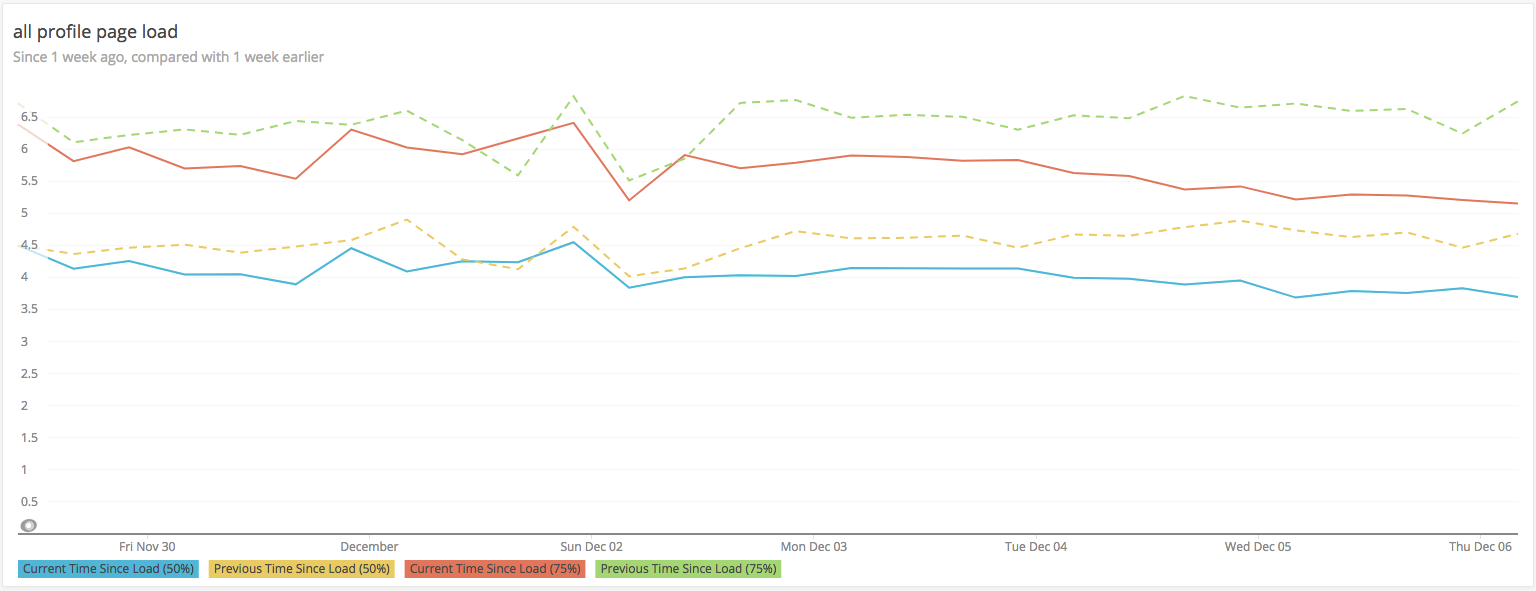
NewRelic lets us chart our RUM numbers over time, comparing week-over-week to spot trends in our data.
--
To accomplish this goal, we use the tracking libraries I described earlier to log success or failure times to NewRelic, our current data aggregation solution. We also track the load time of each specific marker, to allow engineers to track the load time of each particular component on the page. We also log lots of associated data with each page load, including device metrics around CPU and memory, browser version, OS version, asset cache hit rate, and more. This allows us to create really rich analysis around how we can better serve our users.
Code-level A/B Testing
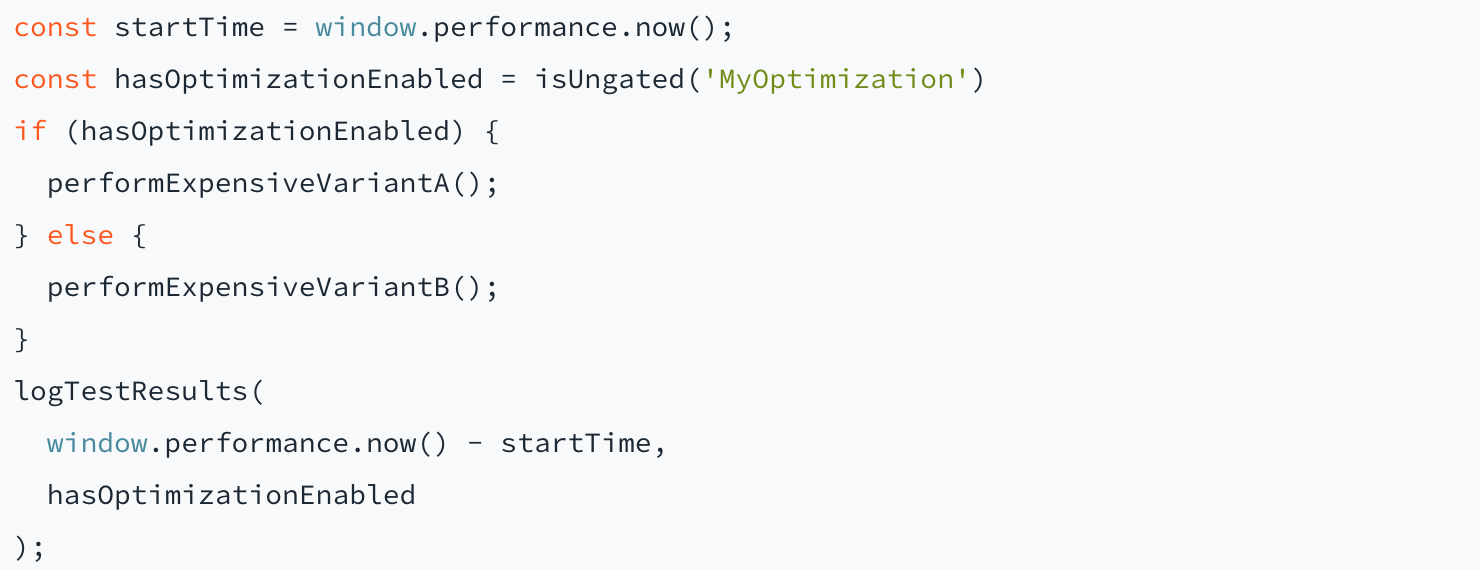
So far we’ve seen two good strategies for tracking an overall application’s performance over time, but what if we are running an experiment and want to know how much a particular change will affect performance? This is where A/B tests come in very handy. We use the browser’s built-in Performance API to track when a particular task started and ended, combined with our internal feature flagging system (called Gates), and then log those timings to NewRelic.
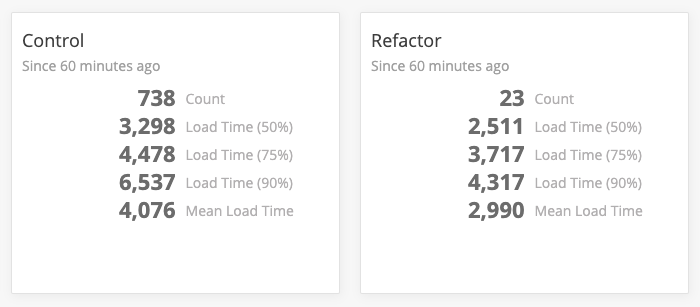
Every time we make a change that may affect performance in an unpredictable way, we’ve encouraged our engineers to run A/B tests behind our feature flagging system. Simply “ungate” some percentage of our customers to a change, track the performance data for a few hours, and then we’ll have an answer. This iterative testing strategy allows us to move very quickly, sometimes shipping 3 to 4 data-driven performance experiments in a single week.
A custom NewRelic dashboard tracking a change’s impact on load performance.
--
While we can run local profiles to measure these changes ourselves, we often find that our internal tests aren’t necessarily reflective of the impact changes will have in production. In a single case, we saw local improvements of nearly 750 milliseconds for a change that ended up having less than a 100 millisecond improvement on performance in production. RUM allows us to test these changes on customers, and because they’re behind feature flags we can revert back to the old changes instantly if we find an experiment has negative impacts.
Goal Setting
Once we had a system in place to track performance data, the next step to creating a delightfully fast experience for our customers was to actually define what “fast” means. While it seems like that may be as simple as choosing a target number, as we started to define these SLAs we realized there were lots of other variables we had to isolate. Do we want to measure international users or just start with users in the US? Should we be measuring background tabs? What constitutes a successful page load, and how do we know when a page is done loading?
Isolate Inconsistent Variables
When we first started measuring our applications’ performance, we ran into lots of problems with inconsistent measurements, both within a single application’s numbers as well as across applications. As mentioned above, variables like foreground versus background tabs created challenges in laying out a consistent set of performance guidelines.
We chose to exclude any page visits that loaded in background tabs, as they’re heavily throttled by browsers and aren’t an accurate representation of our performance. We are also currently excluding international users from our SLAs, though we plan to change this in the future. While we don’t currently have international data centers outside of the US, once our backend supports multi-region replication we’ll likely start to include international data in our measurements as that data will become more meaningful, whereas today we’d be measuring our users’ distance from our data center.
Set Aggressive Goals
While the conventional wisdom suggests choosing smaller, easily attainable goals, we found that without aggressive performance requirements teams would not be as motivated to meet them; the farther away the goal the more motivated teams were to try and meet it. Additionally, we intend to continue to move these targets as more teams get into SLA. While these goals are very aggressive, especially for business applications of our size, we feel that providing a consumer-grade experience of a fast, responsive app is non-negotiable in building modern software.
On the frontend we require that 75% of all page loads for an application finish in less than 2 seconds. Teams are taking a myriad of technical approaches to achieve this, from long-lived asset caches to code splitting, and more. On the backend, 75% of API requests must complete in less than 100 milliseconds. In the last year we’ve become keenly aware that frontend performance has a strong correlation with backend performance. Without a performant, properly architected backend there is no way for the frontend to be performant. Additionally, with our new efforts to treat external integrators on our platform as top-level users, API performance has never been more important.
Results
While the technical details will fill several future blog posts, we’ve been able to combine many strategies including caching expensive work, preventing excessive re-rendering of components, aggregating data fetching via GraphQL or purpose-built aggregator REST endpoints, and aggressive code splitting and JavaScript caching to drastically improve the performance of our applications. Since the start of this project, the number of user-facing apps within the SLA mentioned above has increased from about 5% to nearly 50%, and our apps that aren’t passing are still making notable progress. In one case, our CRM application mentioned earlier, we have seen our 75th percentile load times decrease from around 10 seconds to about 4.5 seconds, and those times are continuing to fall.
Though we have a long way to go, our teams have made an impressive amount of progress in just one year while simultaneously managing to ship new products and provide value to our customers. We’re excited to see our engineers continue to provide investment in this area and discover new ways to provide fast, delightful experiences to our users.