Five ways cookie consent managers hurt web performance (and how to fix them)

I've been spending a lot of time looking at the performance of European sites lately, and have found that the consent management platforms (CMPs) consistently create a false reality for folks when trying to understand performance using synthetic monitoring. Admittedly, this is not a new topic, but I feel it's important enough that it warrants another PSA.
In this post, I will cover some of the issues related to measuring performance with CMPs in place and provide some resources for scripting around consent popups in SpeedCurve.
What are CMPs and how do they work?
A consent management platform (CMP) is a tool that helps organizations handle user consent for data collection and processing, following privacy rules like GDPR or CCPA. On websites, CMPs handle cookie popups. They tell users about cookies and ask for permission before saving them. Unless you've been abstaining from the internet for the past several years, you know consent managers well.
What challenges do CMPs create for performance?
These are some of the most common performance issues caused by content management platforms.
1. Single Point of Failure (SPOF)
As a third party, CMPs can have performance issues of their own that can affect the user experience. It's common to see the consent scripts blocking by design. This can have an impact on most metrics – such as Start Render and Largest Contentful Paint – downstream.
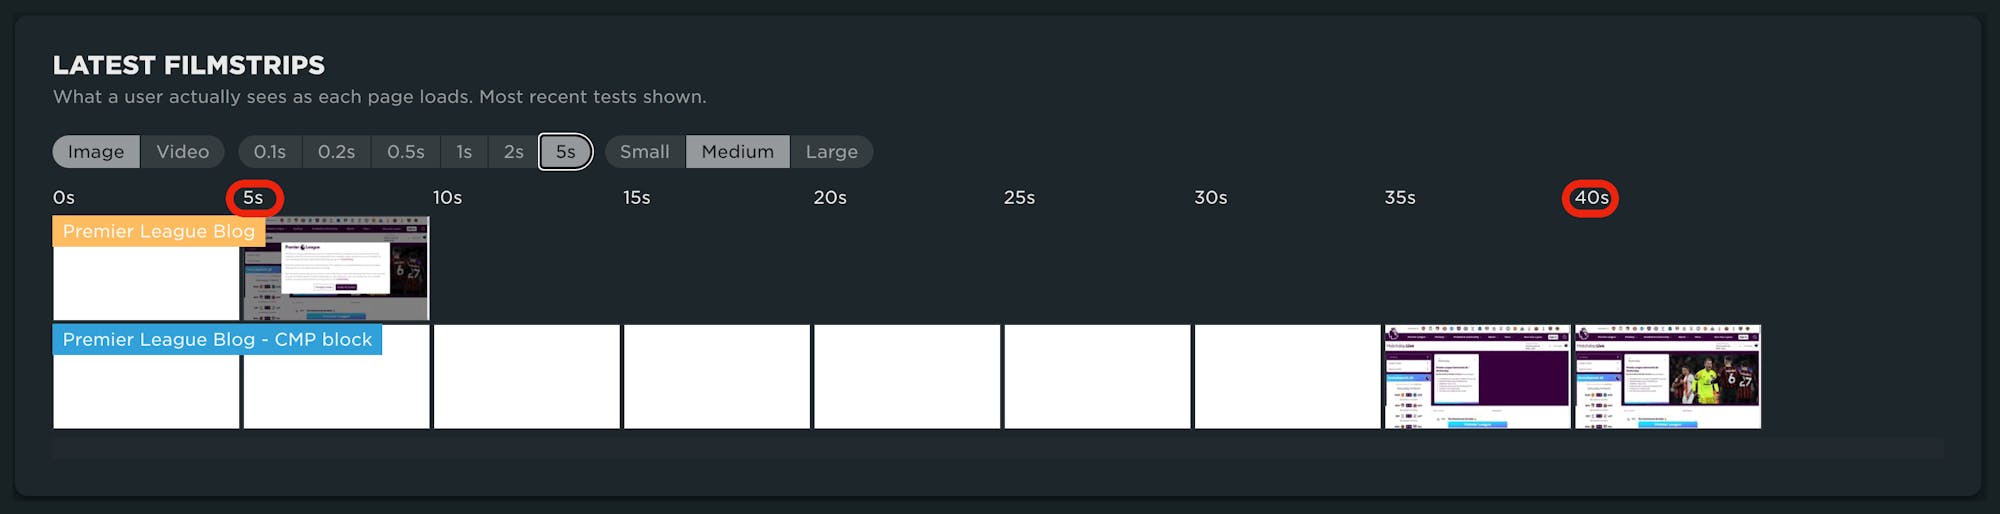
In this example, the synchronous requests for the CMP timed out, causing an extremely long delay in Start Render due to the SPOF. Consent scripts should be loaded async whenever possible.
2. Identifying the wrong LCP element
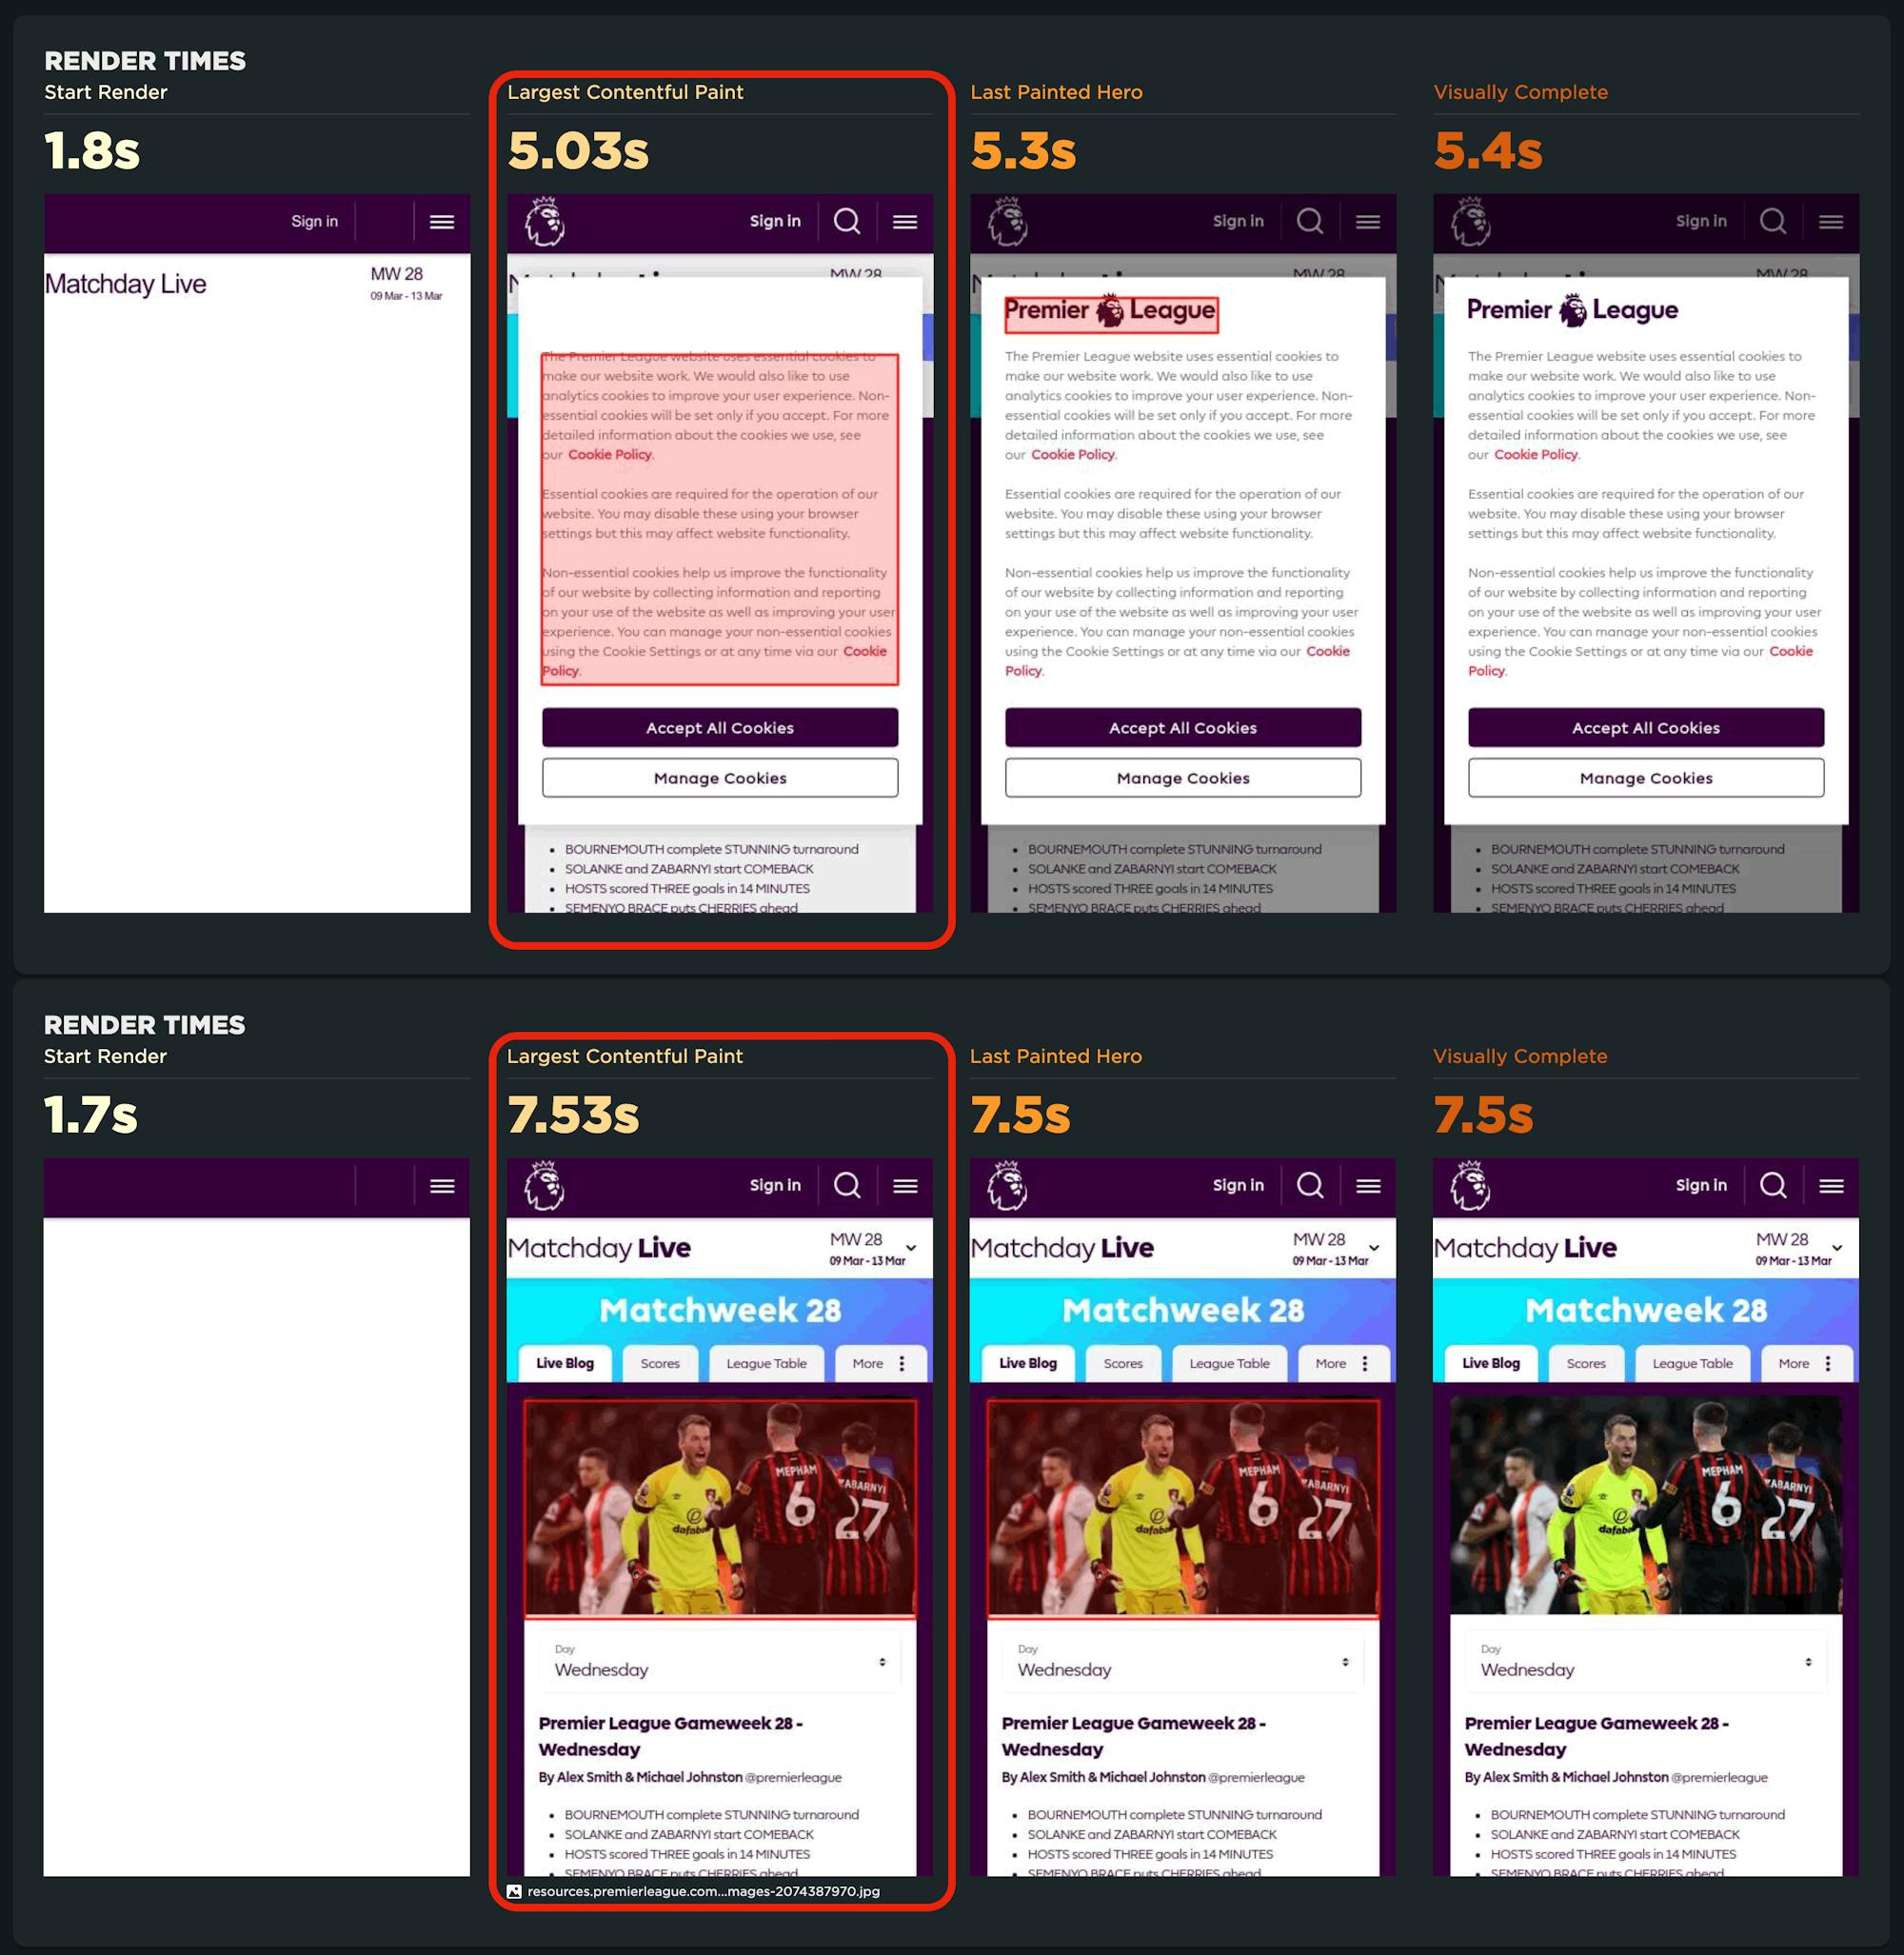
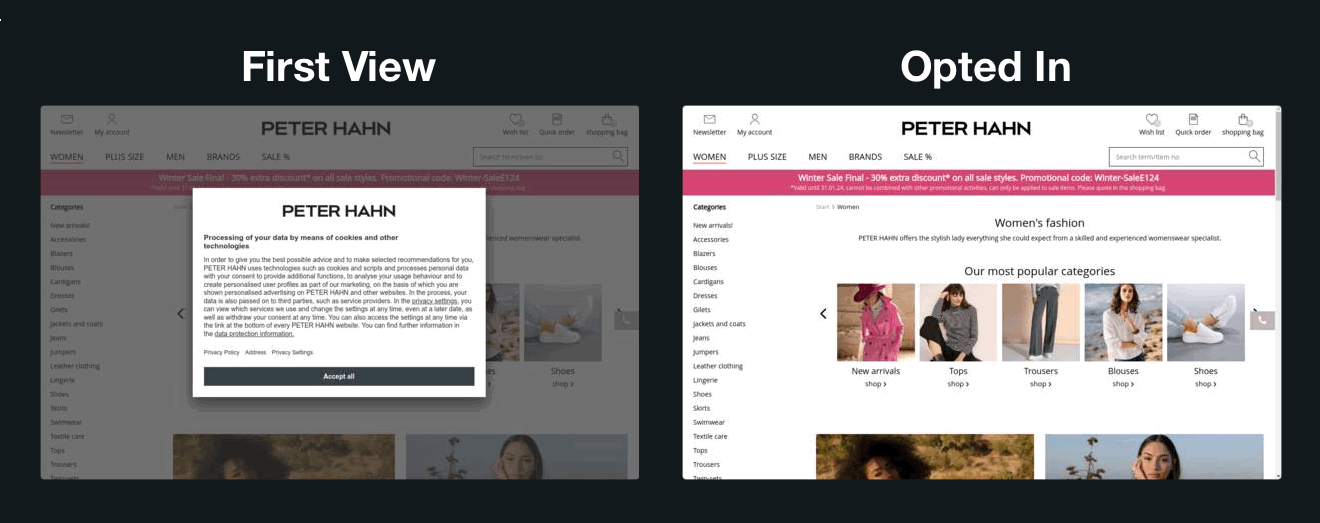
Most people assume the LCP element on a page is their main hero or product image, but they're frequently wrong. Oftentimes the text or element in the consent popup is identified as the LCP element. While this may be technically accurate, it's probably not what you want to measure.
In this case, LCP is slower after opt-in, when the hero image has taken 2.5s longer to load.
3. Consent banners can hurt Cumulative Layout Shift scores
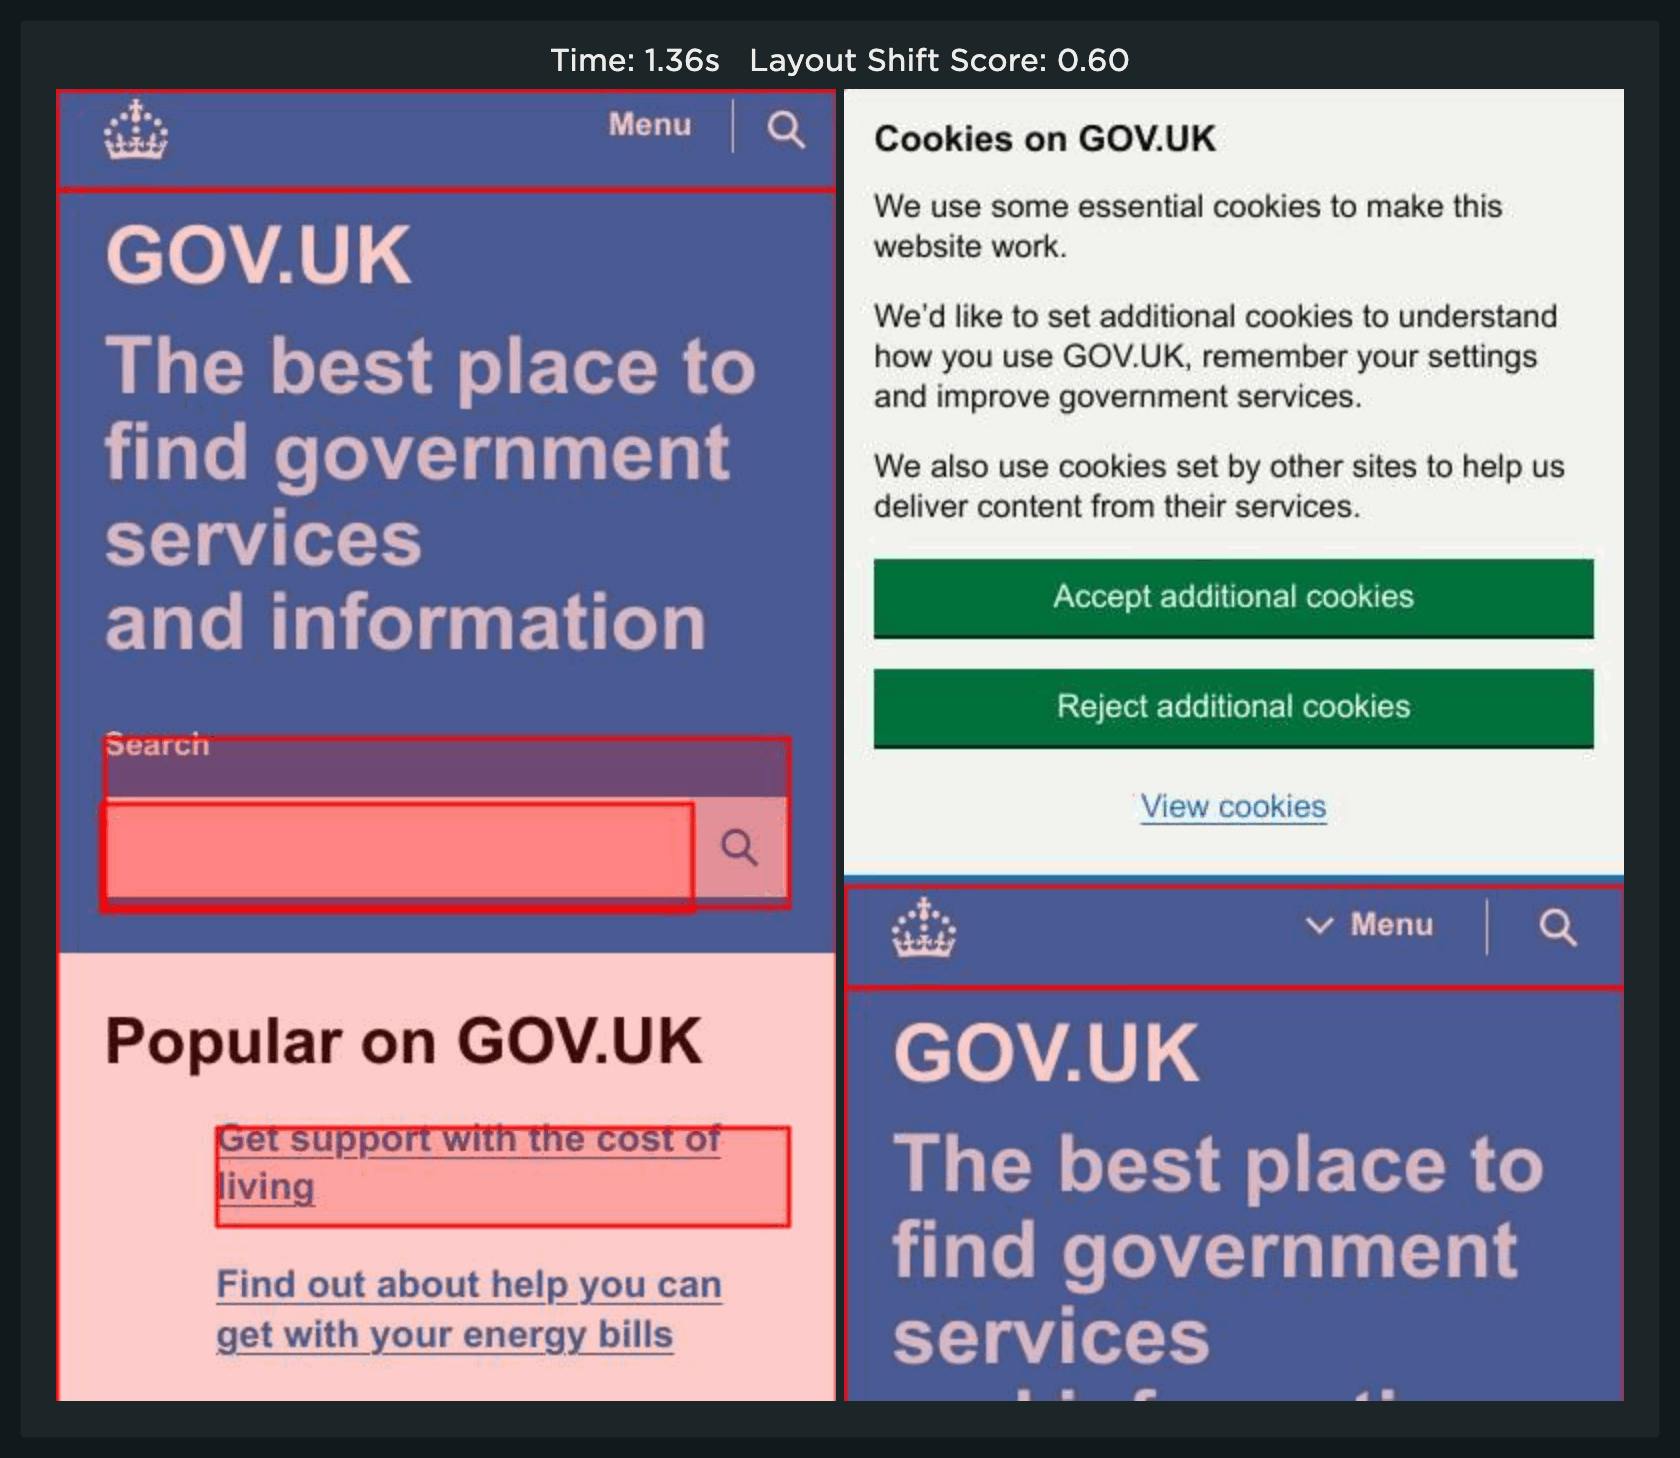
Some sites choose to use a consent banner instead of a popup. As Andy Davies discovered, this can sometimes cause CLS issues, depending on how the banner is implemented. In this example, the consent banner causes a large layout shift for first-time viewers, pushing the CLS score well beyond recommended Core Web Vitals thresholds.
Sia Karamalegos from Shopify provided another great example of how cookie notices that are animating position properties vs. using the preferred method of CSS transform can cause massive CLS scores. (Side note: This post is a great read for anyone looking to optimize for CLS their Shopify site)
4. Masking third-party performance
Assuming that you have visibility into your third-party performance is another pitfall when testing the first view of a site synthetically. For some site owners, the difference between the initial experience and an an opted-in experience can be extreme due to the presence of third-party JavaScript.
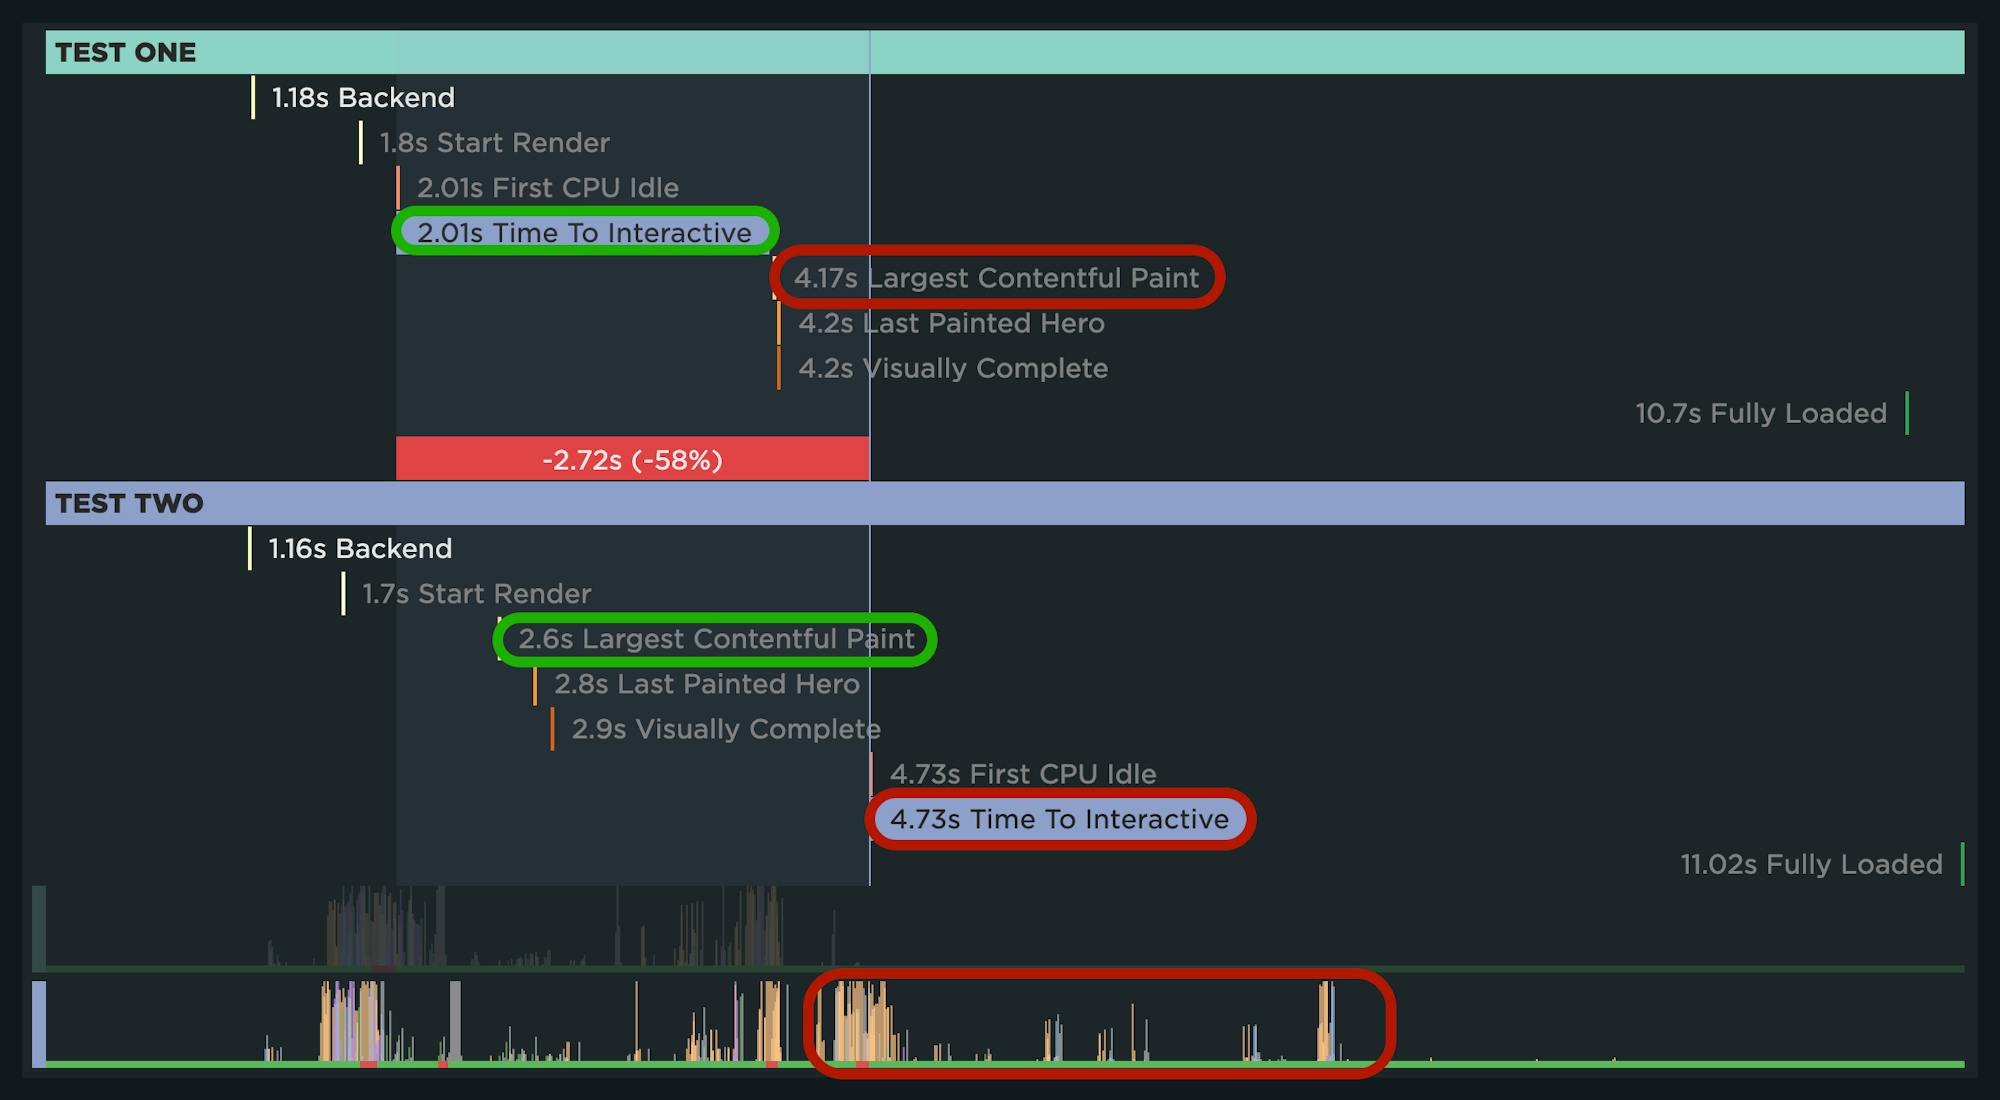
If you were just looking at metrics, the event timeline comparison below may be a bit of a head-scratcher. LCP is deceptively slower in the first view, due to the late render of the consent popup, whose text block is identified as the LCP element. Meanwhile, Time to Interactive (TTI) is much faster. If you look at the highlighted activity timeline, it's apparent that the third-party JavaScript for the opted-in experience creates a lot of additional CPU activity and Long Tasks.
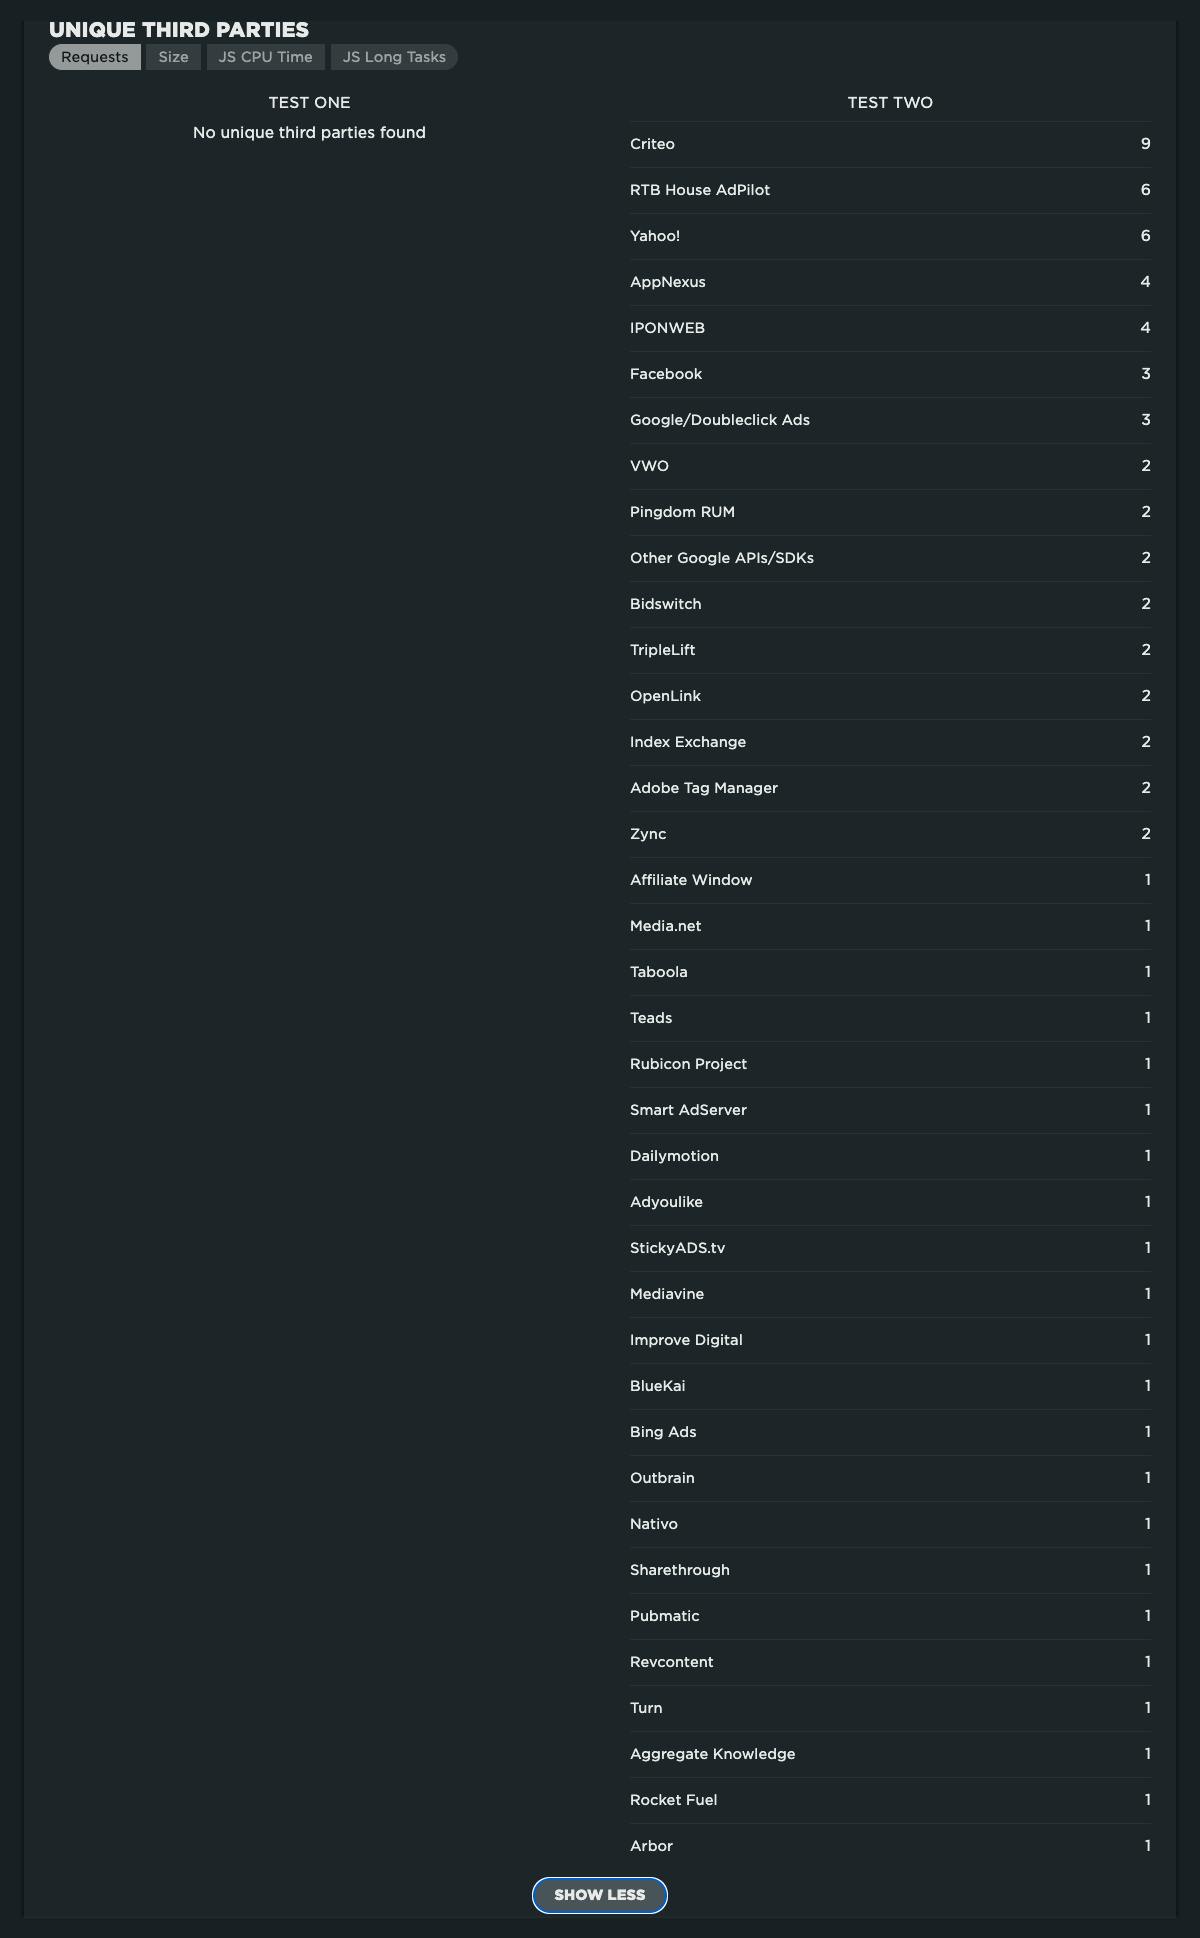
The opted-in experience also loads an additional 73 third-party requests!
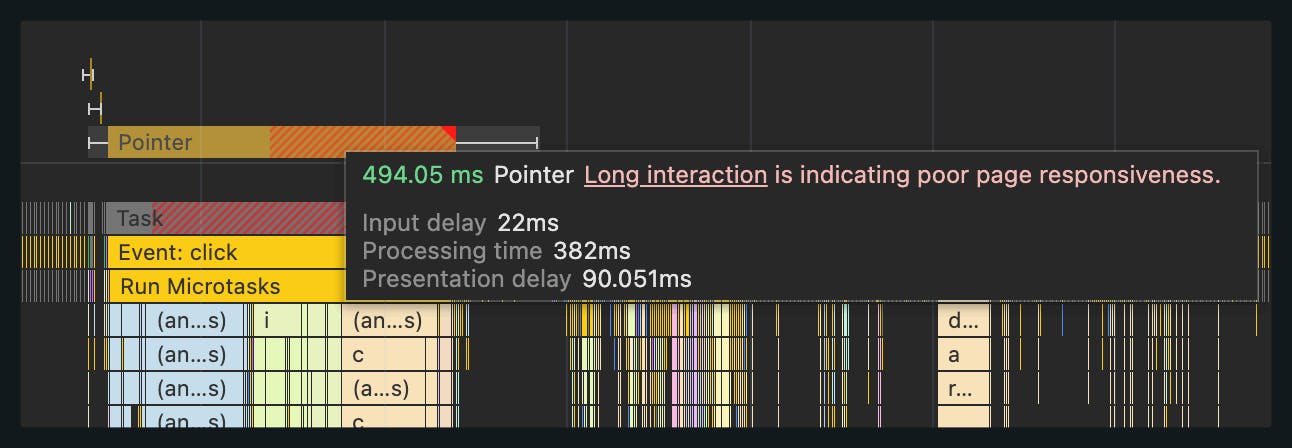
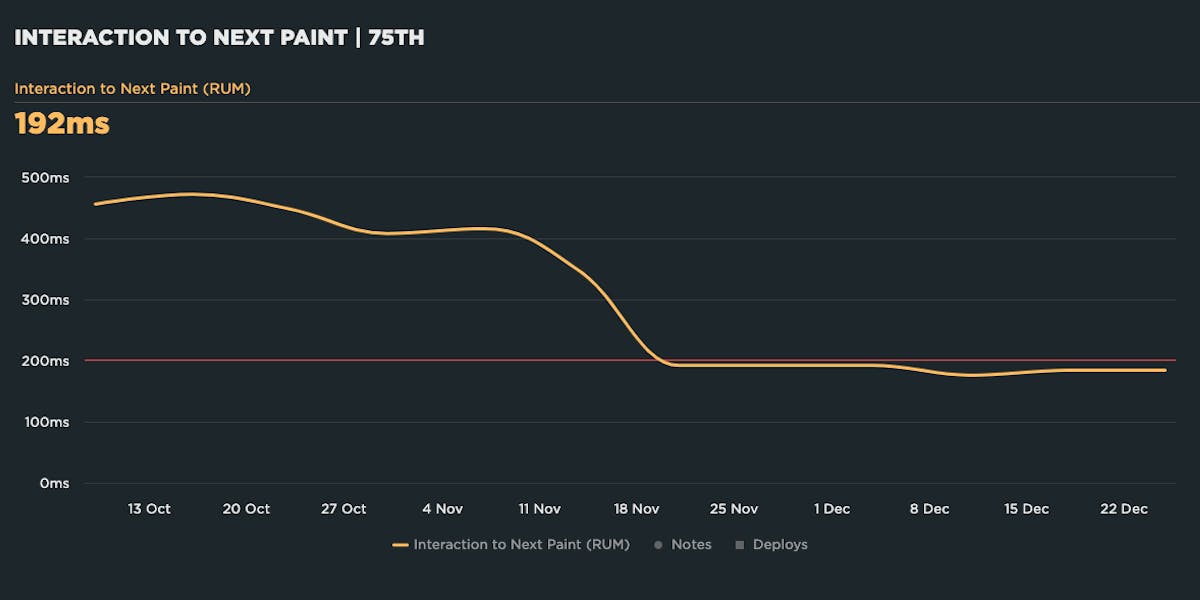
5. Interaction to Next Paint (INP) and cookie consent
In his latest blog post on debugging INP, Andy Davies provides an example (#3) of how the interaction of accepting the consent dialog causes high processing time. This is due to the functions called from the Event Handler. Given the recent announcement that INP has replaced First Input Delay as a Core Web Vital, this is certainly something to look out for.
How do I bypass the CMP?
Testing an opted-in experience is highly recommended. This is possible by setting the correct cookie values or in some cases localStorage entries.
If you're a SpeedCurve user, we've created a Scripting Cookie Consents Guide with scripting examples for some of the more common CMPs. This includes LiveRamp, OneTrust, Quantcast Choice, TrustArc and Usercentrics.
If possible, you should test both experiences – pre- and post-opt-in – and treat them as the unique experiences they are.
It's been said before...
Katie Hempenius, Simon Hearne, Sia Karamalegos, Andy Davies and others have done deep dives into this topic. I've learned a ton from them, and frankly repeated a lot of what they said. Again, this is a PSA that warrants over-communication! ;)
Here are some must-reads by these fine folks:
- Best practices for cookie notices
- Measuring Performance Behind Consent Popups
- Bypassing Cookie Consent Banners in Lighthouse and WebPageTest
- Element Timing: One true metric to rule them all?
- Debugging Interaction to Next Paint
- Optimizing CLS for Shopify sites

Read Next
Learn what INP is, how to identify and debug slow interactions... and most important, how to make them faster!

Largest Contentful Paint might miss the most important elements on the page. Here's how Element Timing can help you measure the moments that matter for your visitors.